Who Writes the Bugs? A Deeper Look at 125,000 Kernel Vulnerabilities
Part 2 of our kernel vulnerability analysis. Part 1 covered bug lifetimes and VulnBERT. This post digs into the human side: who introduces vulnerabilities, when they do it, and what we can do about it.
KeywordsLinux, kernel, security, vulnerabilities, VulnBERT
15 sections · 3194 words
Part 2 of our kernel vulnerability analysis. Part 1 covered bug lifetimes and VulnBERT. This post digs into the human side: who introduces vulnerabilities, when they do it, and what we can do about it.
In Part 1, I analyzed 125,000 kernel bugs and found they hide for 2.1 years on average, with race conditions surviving over twice as long as other bug types. I built VulnBERT to catch them at commit time.
But that analysis treated bugs as abstract data points. This time I asked different questions: Who writes the buggy code? When do they write it? And who are the super-reviewers who catch bugs faster than anyone else?
The answers surprised me. Weekend commits are actually less likely to introduce vulnerabilities, but they take 45% longer to fix. Intel contributes the most bugs because they contribute the most code. And 117 "super-reviewers" catch bugs nearly twice as fast as everyone else.
The findings point toward concrete process improvements that could reduce average bug lifetime by 35%.
| Key findings at a glance | |
|---|---|
| 117 | Super-reviewers who catch bugs 47% faster than average |
| 0.88 years | Self-fix lifetime (vs 2.59 years for cross-fixes) |
| -8% | Weekend commits are LESS likely to be vulnerable |
| +45% | But weekend bugs take longer to fix (review coverage) |
| 5.0 years | Average lifetime for race conditions (2x deadlocks) |
| ~35% | Estimated reduction possible with process improvements |
The Super-Reviewers
Not all bug-fixers are created equal. When I ranked everyone who had fixed at least 50 bugs, a clear pattern emerged: some people consistently find bugs faster than others.
I defined a super-reviewer as someone who:
- Has fixed 100+ bugs
- Has an average fix lifetime 20%+ below the global average
117 people meet this criteria. And the impact is dramatic:
| Metric | Value |
|---|---|
| Global average bug lifetime | 2.1 years |
| Super-reviewer average | 1.1 years |
| Difference | 47% faster |
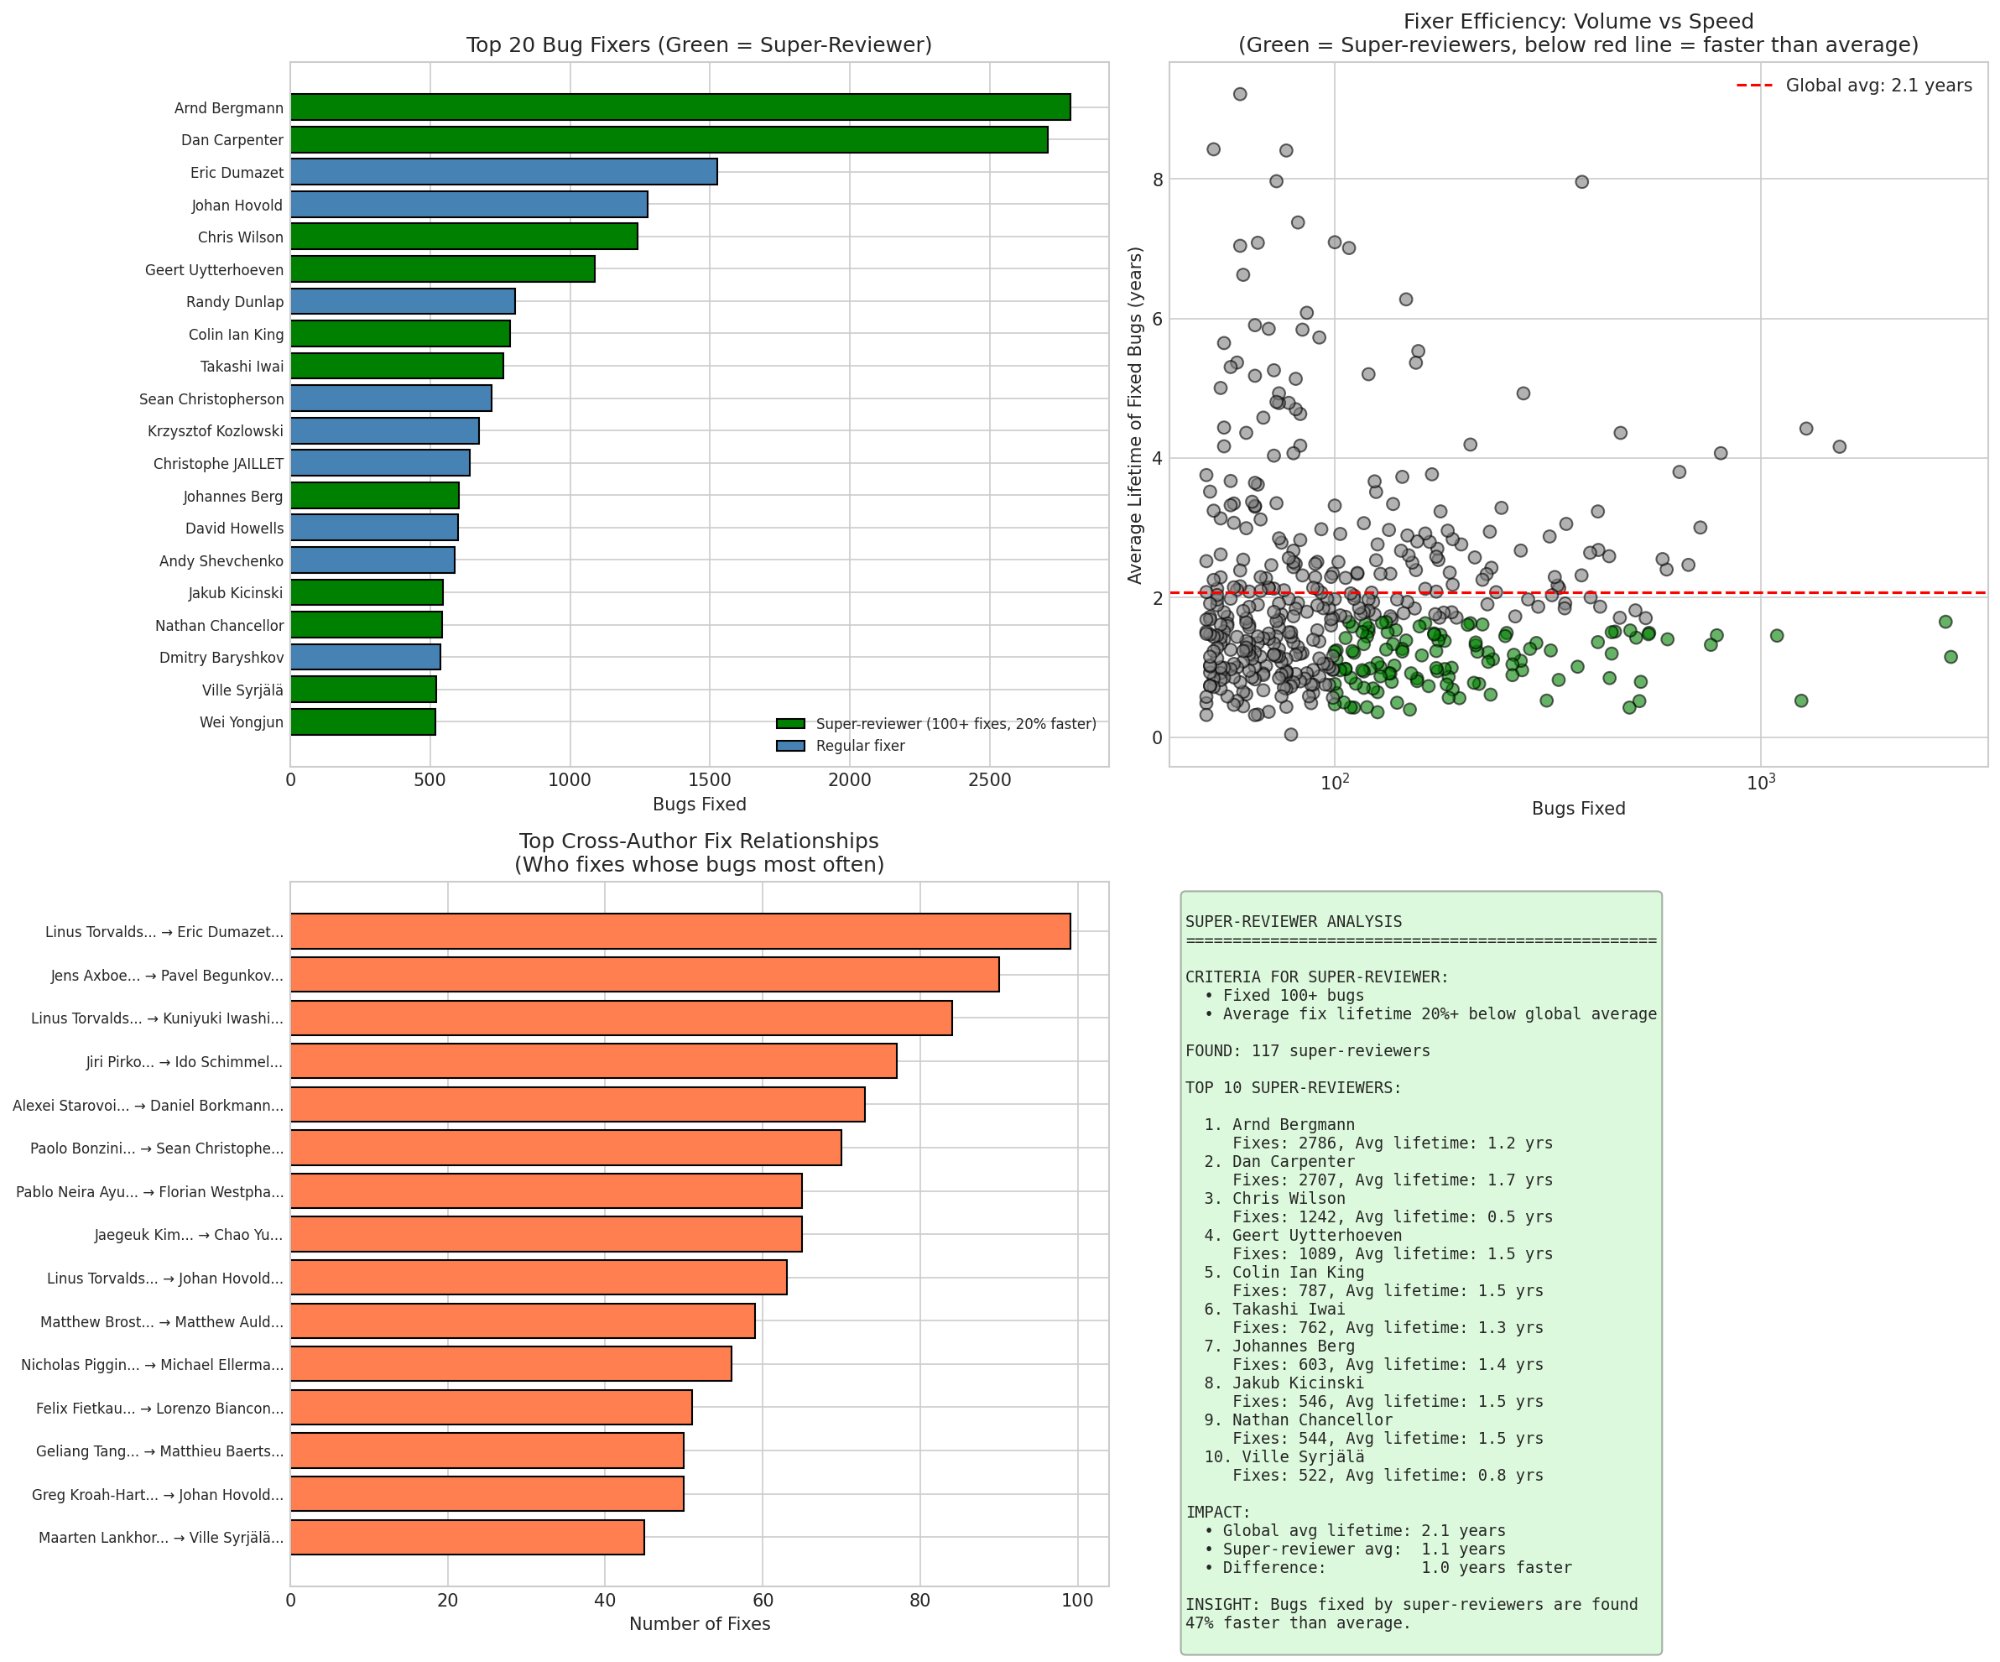 Top 20 bug fixers. Green = super-reviewers (100+ fixes, 20% faster than average). The scatter plot shows volume vs speed super-reviewers cluster in the bottom-right (high volume, low lifetime).
The top 10 super-reviewers:
| Rank | Name | Bugs Fixed | Avg Lifetime |
|---|---|---|---|
| 1 | Arnd Bergmann | 2,786 | 1.2 years |
| 2 | Dan Carpenter | 2,707 | 1.7 years |
| 3 | Chris Wilson | 1,242 | 0.5 years |
| 4 | Geert Uytterhoeven | 1,089 | 1.5 years |
| 5 | Colin Ian King | 787 | 1.5 years |
| 6 | Takashi Iwai | 762 | 1.3 years |
| 7 | Johannes Berg | 603 | 1.4 years |
| 8 | Jakub Kicinski | 546 | 1.5 years |
| 9 | Nathan Chancellor | 544 | 1.5 years |
| 10 | Ville Syrjälä | 522 | 0.8 years |
Chris Wilson is extraordinary: 1,242 fixes at 0.5 years average. He's finding bugs 4x faster than the global average. Ville Syrjälä is similar at 0.8 years.
A note on Dan Carpenter: Beyond his 2,707 bug fixes, Dan invented the Fixes: tag convention that makes this entire analysis possible. When a kernel developer fixes a bug, they add a line like Fixes: abc123def ("original commit subject") to link the fix back to the introducing commit. This simple convention, now standard practice, created the 125,000-pair dataset we're analyzing. Dan didn't just fix more bugs than almost anyone, he built the system that lets us track them.
What makes them different? Looking at their fix patterns:
- Both focus heavily on GPU/i915, a subsystem with strong fuzzing infrastructure
- Both are deeply embedded in their subsystems (Chris Wilson was a lead i915 developer)
- They fix bugs they didn't introduce. They're actively hunting, not just cleaning up their own messes
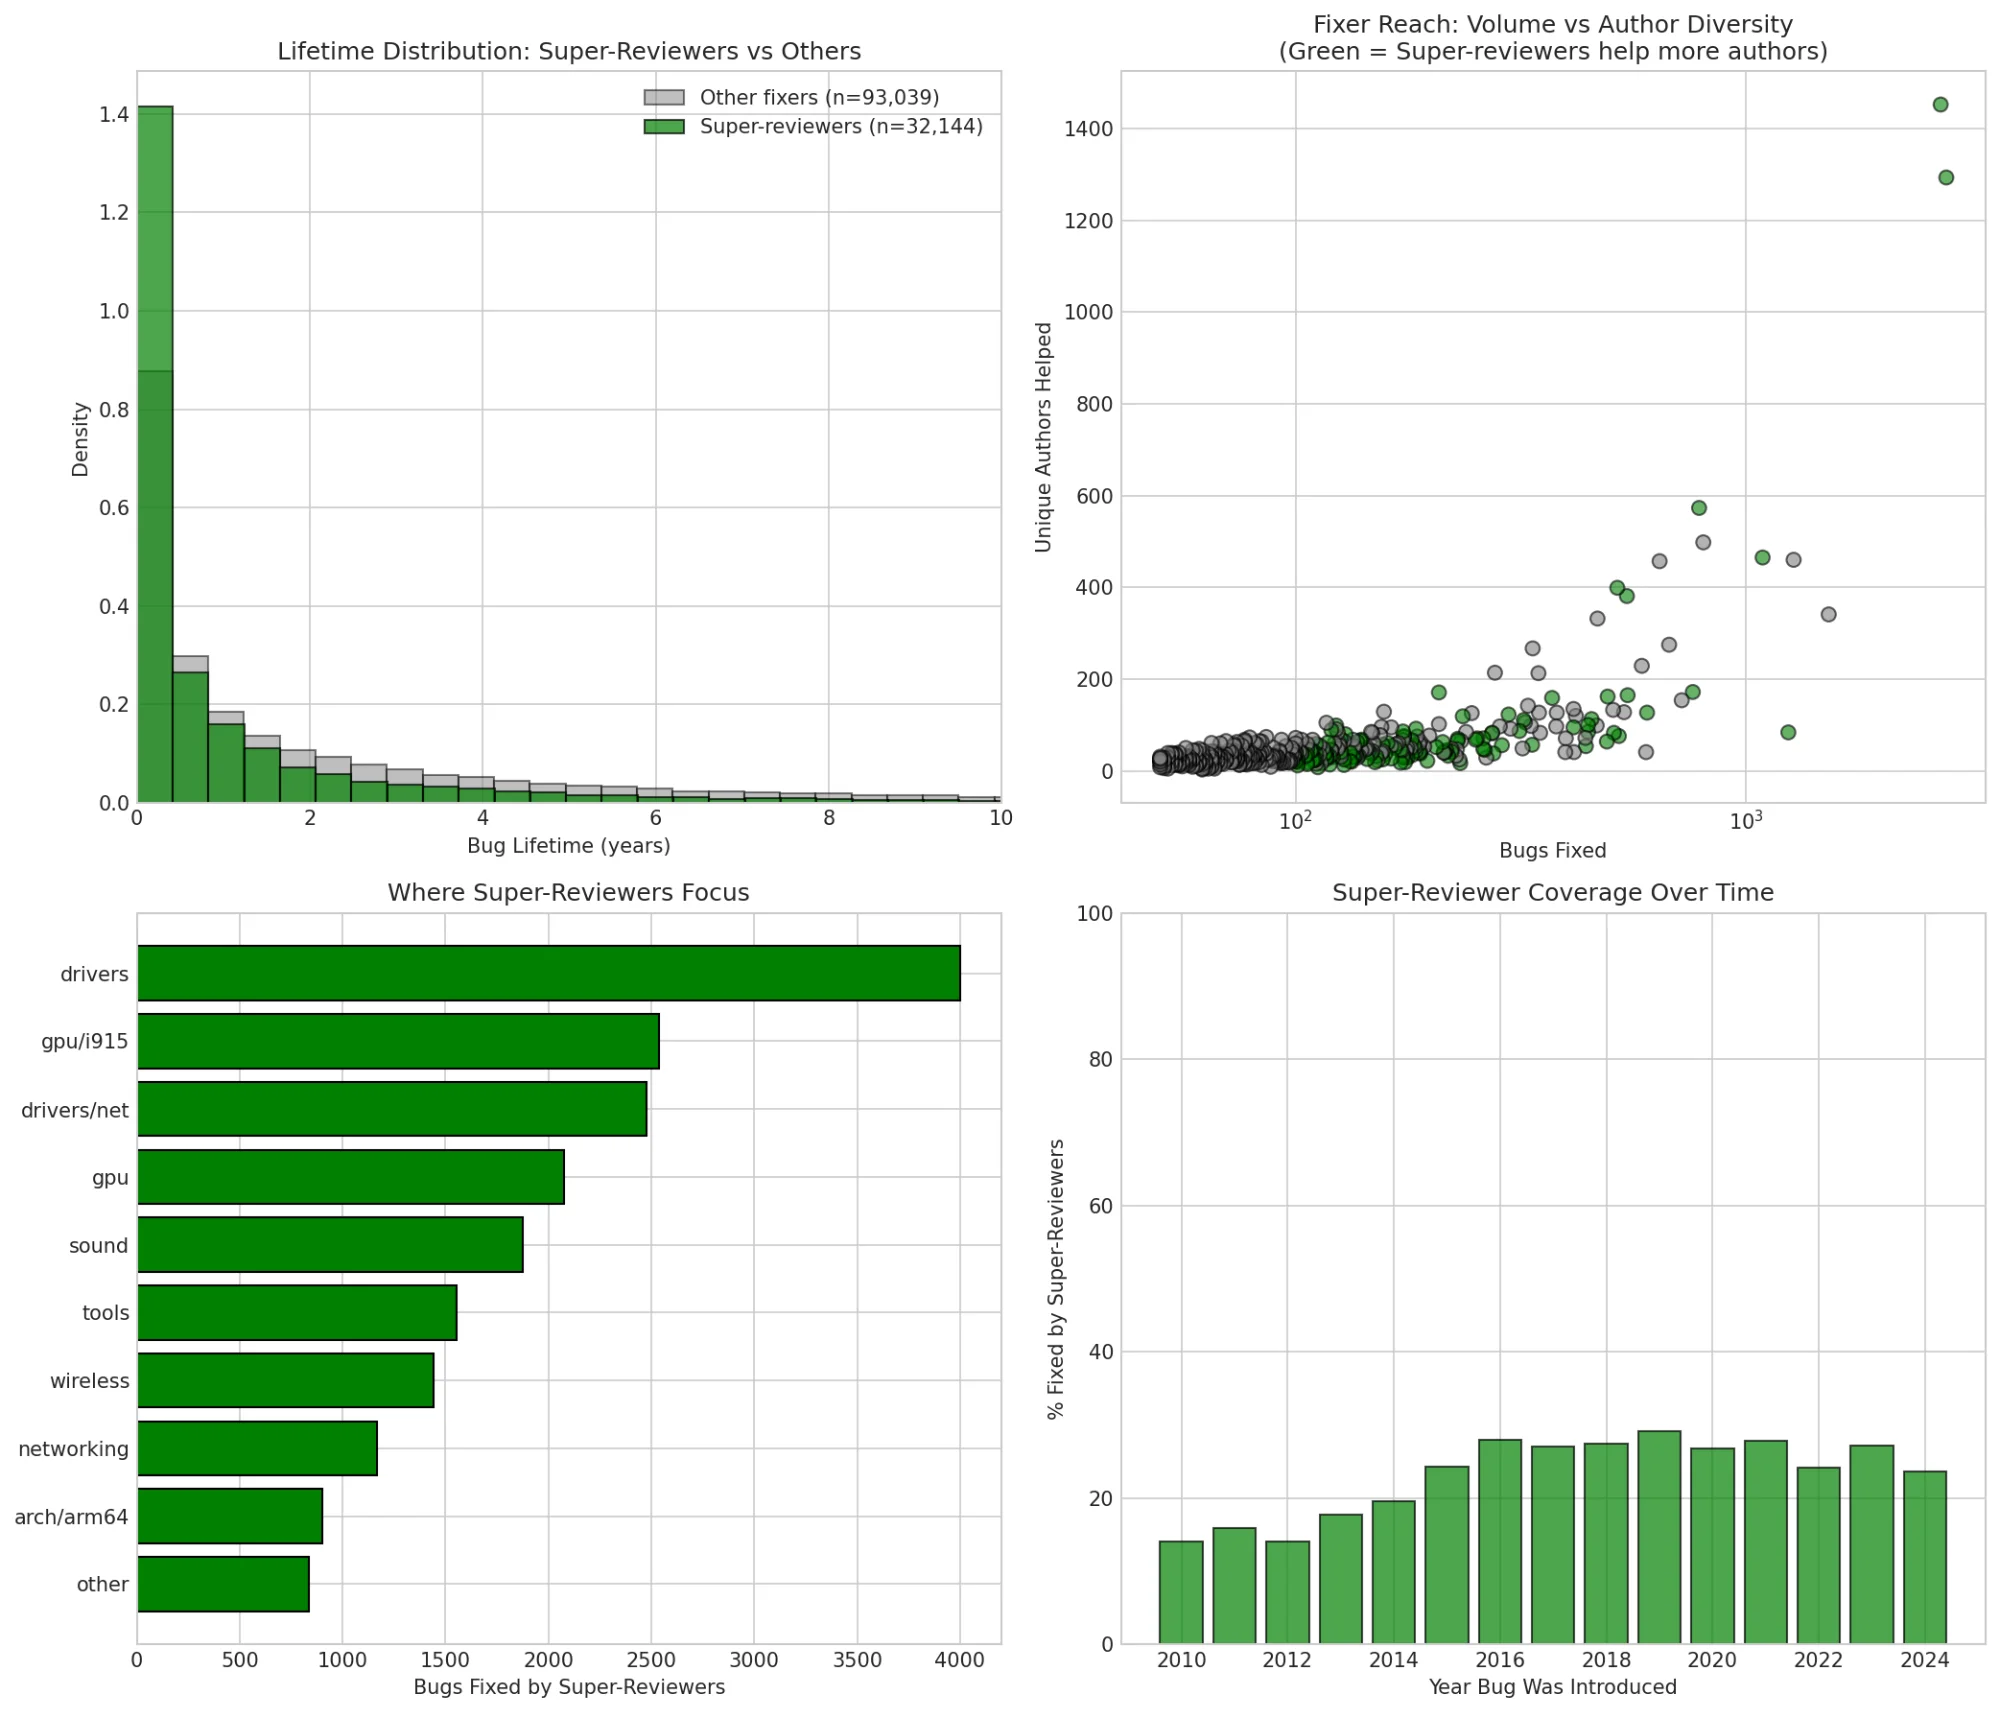 Super-reviewers (green) fix bugs from more unique authors, focus on drivers/gpu, and their coverage has increased from 15% to 30% over the past decade.
The coverage trend is encouraging: In 2010, super-reviewers fixed ~15% of bugs. By 2020-2024, that's risen to ~30%. More super-reviewers = faster bug discovery for the whole kernel.
Self-Fixes Are 3x Faster
Here's a finding that should change how we think about code ownership:
| Fix Type | Average Lifetime |
|---|---|
| Self-fixed (same author) | 0.88 years |
| Fixed by someone else | 2.59 years |
Bugs fixed by the original author are found 3x faster.
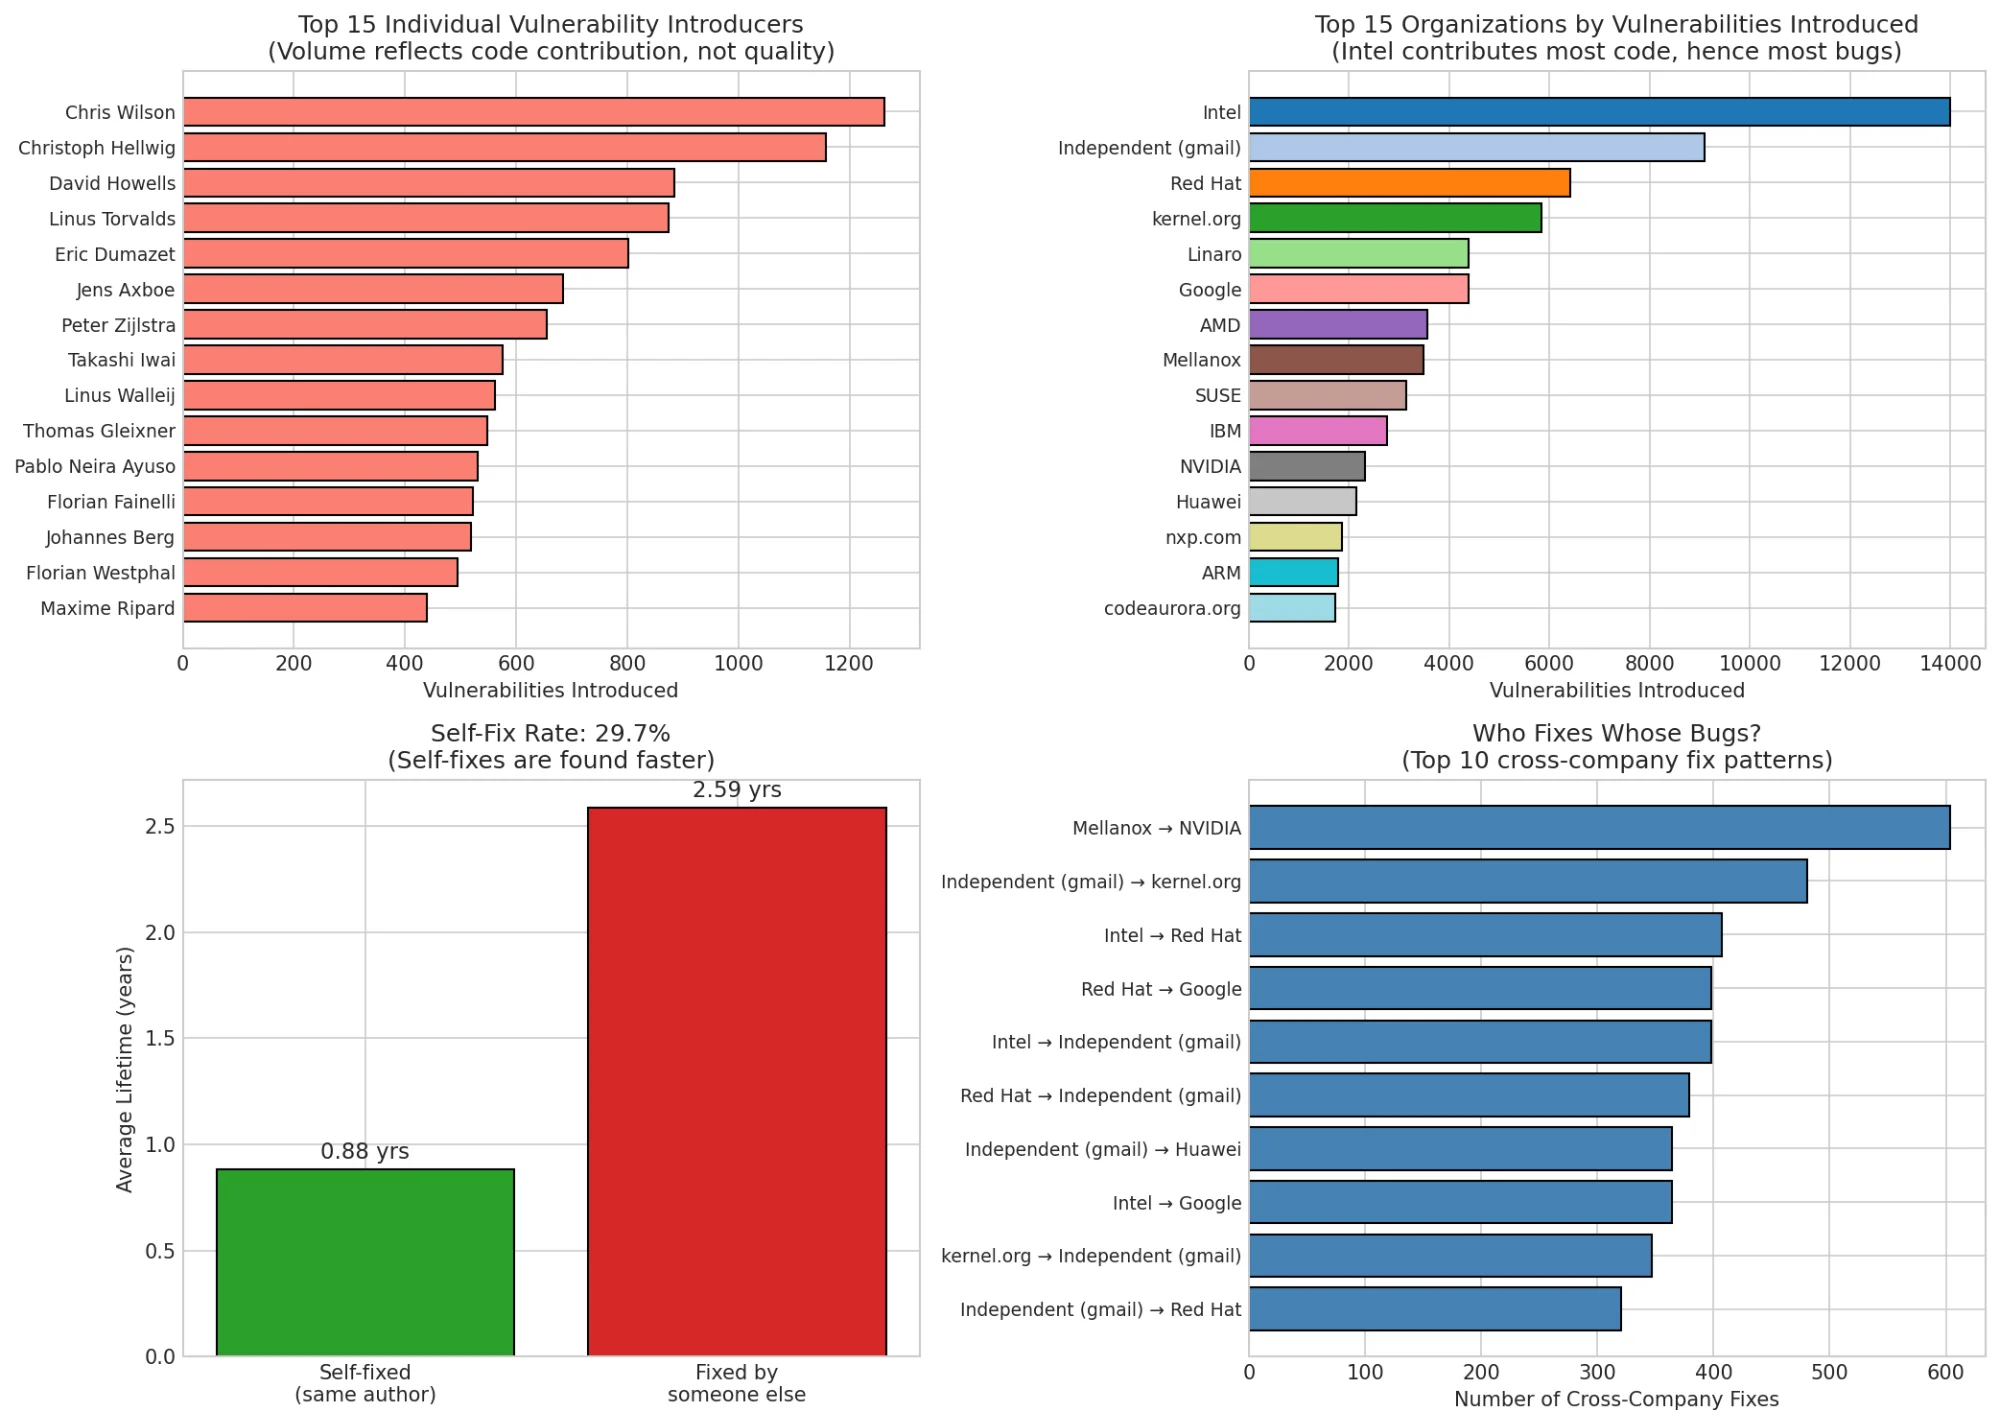 Bottom-left: Self-fixes (green) have dramatically shorter lifetimes than cross-fixes (red). Bottom-right: Top cross-company fix relationships.
The self-fix rate is 29.7%, nearly a third of bugs are eventually fixed by the person who introduced them. These developers have institutional knowledge: they understand the code's invariants, they recognize when something feels wrong, and they're watching their subsystems.
Implication: Code ownership matters. Encouraging developers to maintain long-term ownership of their code (rather than fire-and-forget contributions) could significantly reduce bug lifetimes.
The Corporate Landscape: Who Really Builds the Kernel?
Before we talk about who introduces bugs, let's look at who writes the kernel in the first place. I analyzed 1.4 million commits to map the corporate landscape.
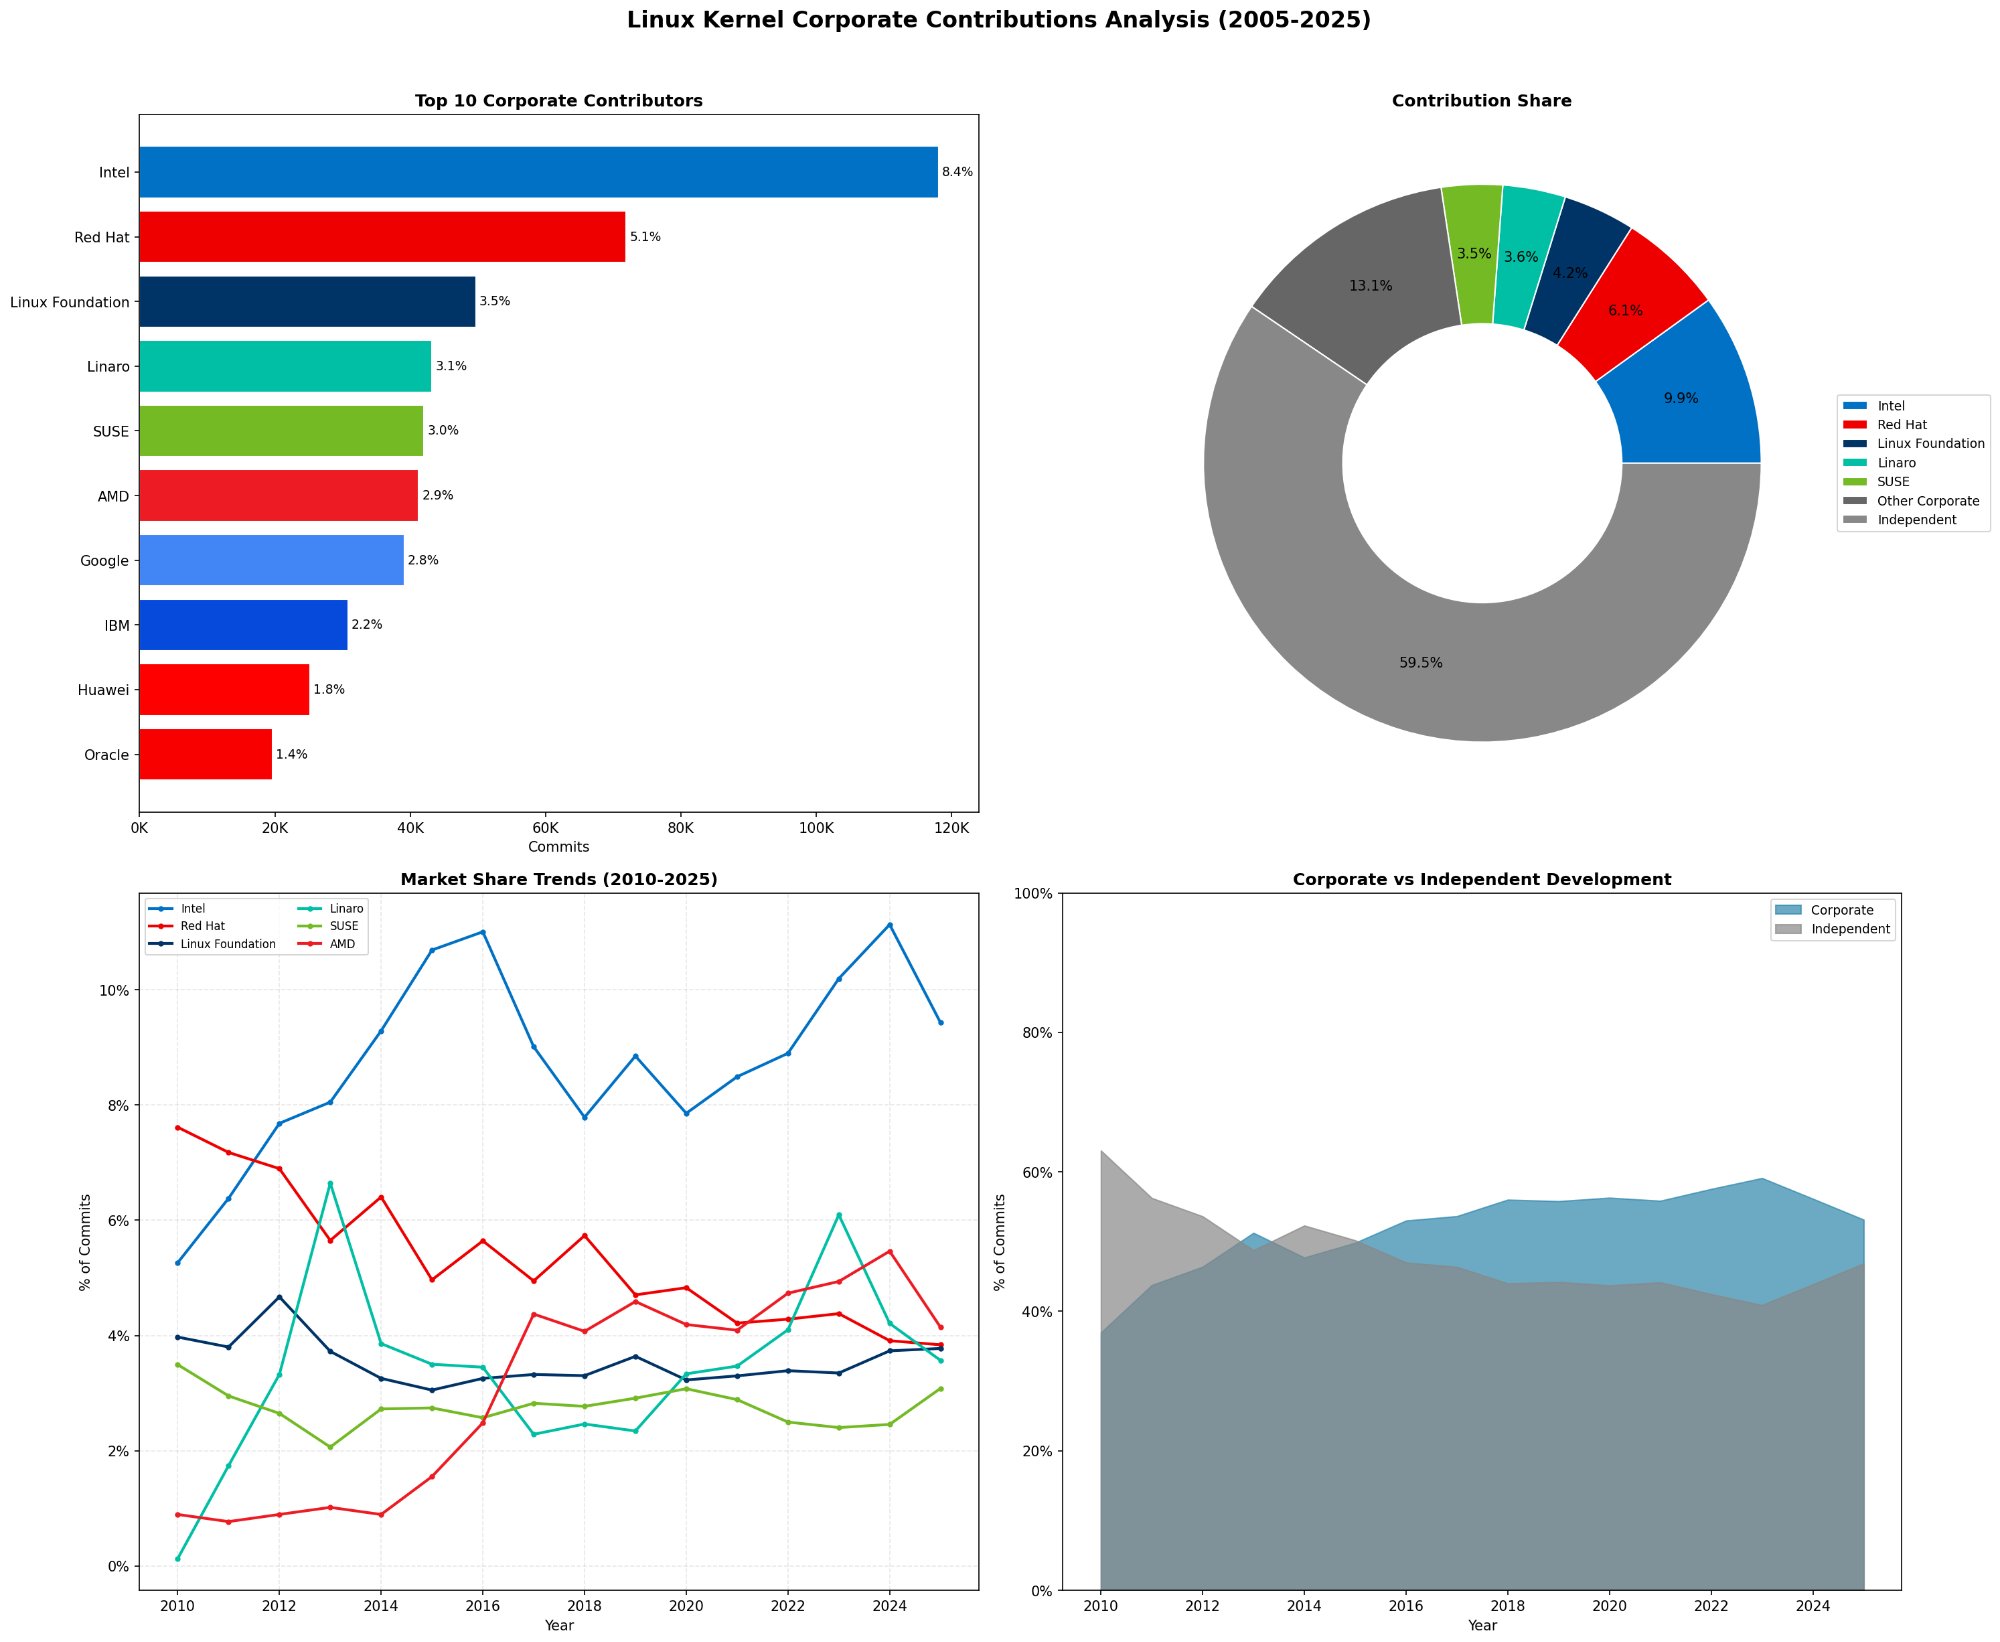 The Linux kernel's corporate ecosystem. Intel dominates with 8.4% of commits, but independent contributors still account for 50% of all development.
The numbers are striking:
| Organization | Commits | Share |
|---|---|---|
| Independent/Personal | 706,224 | 50.1% |
| Intel | 118,073 | 8.4% |
| Red Hat | 71,891 | 5.1% |
| Linux Foundation | 49,696 | 3.5% |
| Linaro | 43,192 | 3.1% |
| SUSE | 42,018 | 3.0% |
| AMD | 41,250 | 2.9% |
| 39,118 | 2.8% |
Half the kernel is still built by individuals: people using gmail.com, personal domains, or university emails. The "corporate takeover" narrative is overstated. Companies contribute heavily, but the kernel remains a genuinely collaborative project.
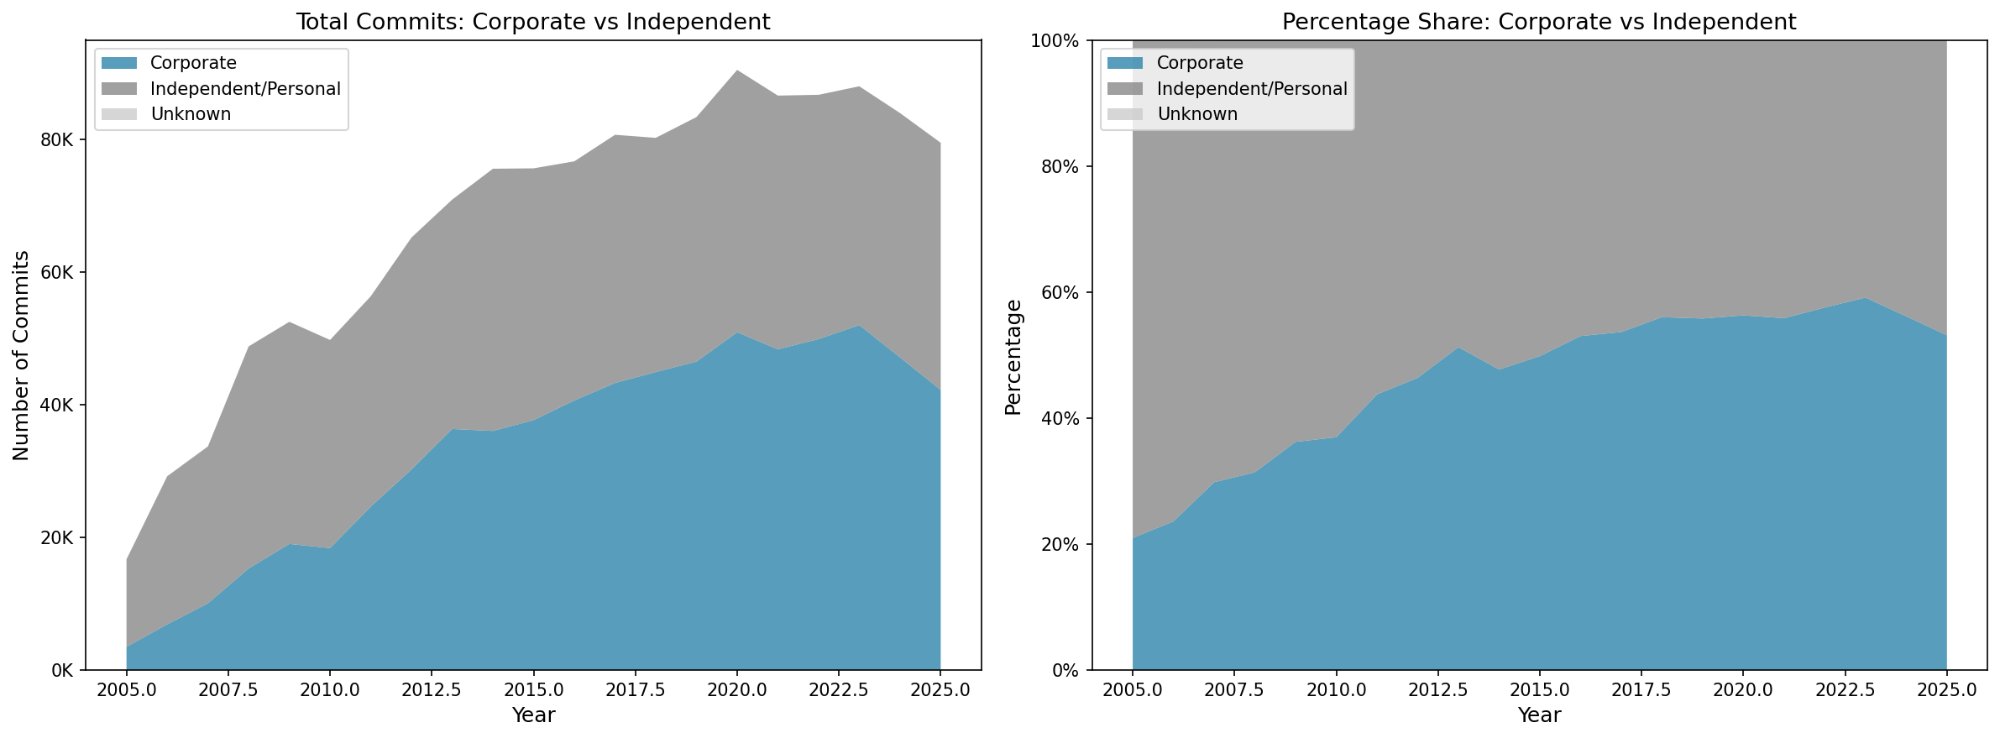 Corporate share has grown from ~25% in 2005 to ~55% today, but independent contributors still matter enormously.
The trend is real: corporate contributions have doubled as a share of commits since 2005. But this reflects growth in total kernel development, not displacement of volunteers. Independent contributor counts have remained relatively stable.
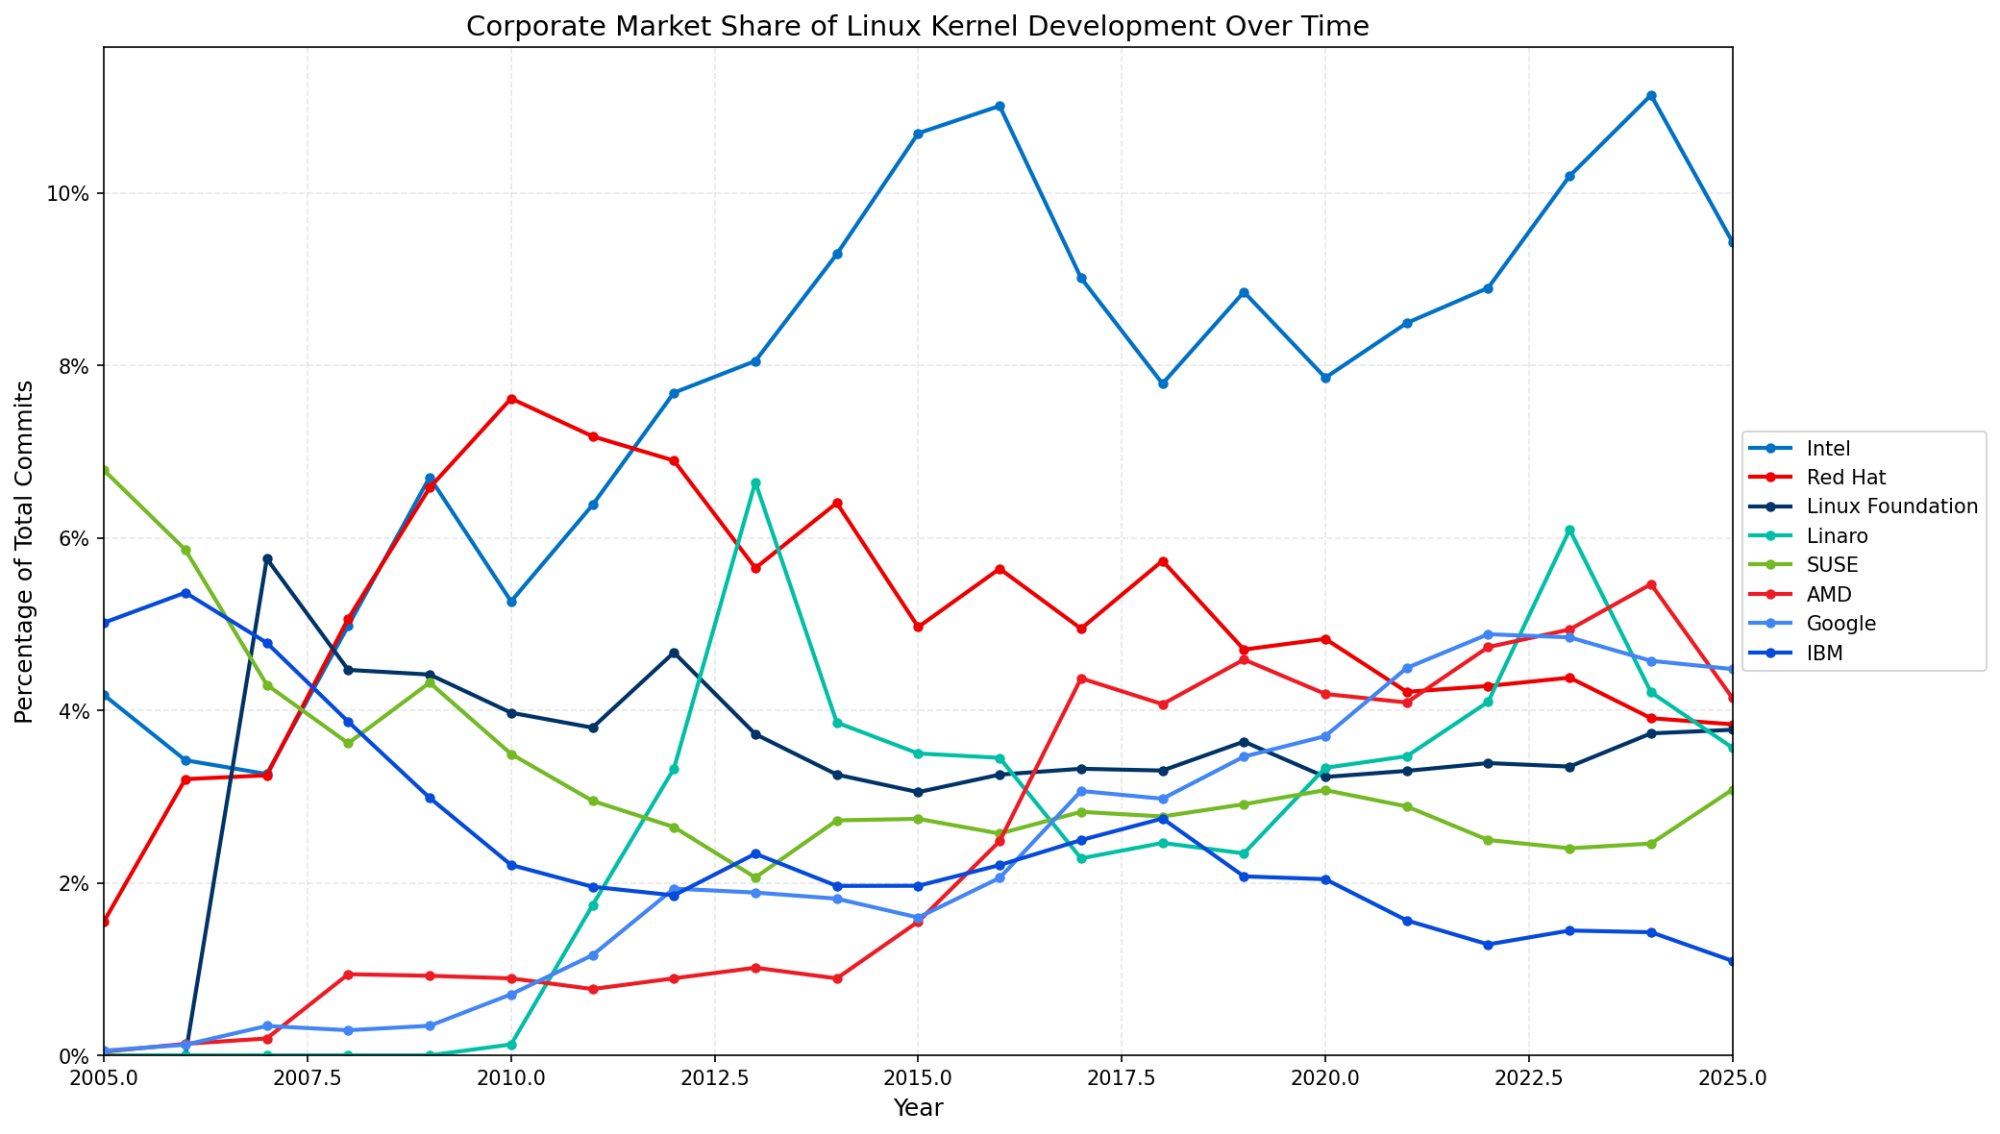 Intel's dominance peaked around 2016 at 11% and has stabilized around 9-10%. AMD's share has grown dramatically since 2020.
Intel's journey is interesting. They peaked at 11% market share around 2016, driven by i915 GPU driver development. Since then, they've stabilized around 9-10% while AMD has grown from near-zero to ~5%, reflecting AMD's CPU and GPU resurgence.
Intel Introduces the Most Bugs (Because They Write the Most Code)
When I mapped author emails to organizations:
| Organization | Bugs Introduced |
|---|---|
| Intel | 14,000 |
| Independent (gmail.com) | 10,000 |
| Red Hat | 7,000 |
| kernel.org maintainers | 6,000 |
| Linaro | 5,500 |
| 5,000 | |
| AMD | 4,000 |
Intel's dominance reflects contribution volume, not code quality. They maintain massive driver subsystems (i915 GPU, networking, platform code). More code = more bugs, even at the same defect rate.
In fact, Intel's bug rate is roughly proportional to their commit share. They contribute 8.4% of commits and ~11% of bugs which is slightly elevated but not dramatically. The difference may reflect the complexity of driver code vs. simpler patches.
The cross-company fix patterns are revealing:
| Relationship | Fixes |
|---|---|
| Mellanox → NVIDIA | 600+ |
| Independent → kernel.org | 500+ |
| Intel → Red Hat | 420+ |
| Red Hat → Google | 400+ |
Mellanox → NVIDIA makes sense. NVIDIA acquired Mellanox, so they inherited the codebase. Independent → kernel.org shows maintainers cleaning up community contributions. The Intel ↔ Red Hat relationship reflects their collaboration on shared infrastructure (virtualization, networking).
The Weekend Effect: Fewer Bugs, But They Hide Longer
I expected late-night commits to be buggier. The data told a more nuanced story.
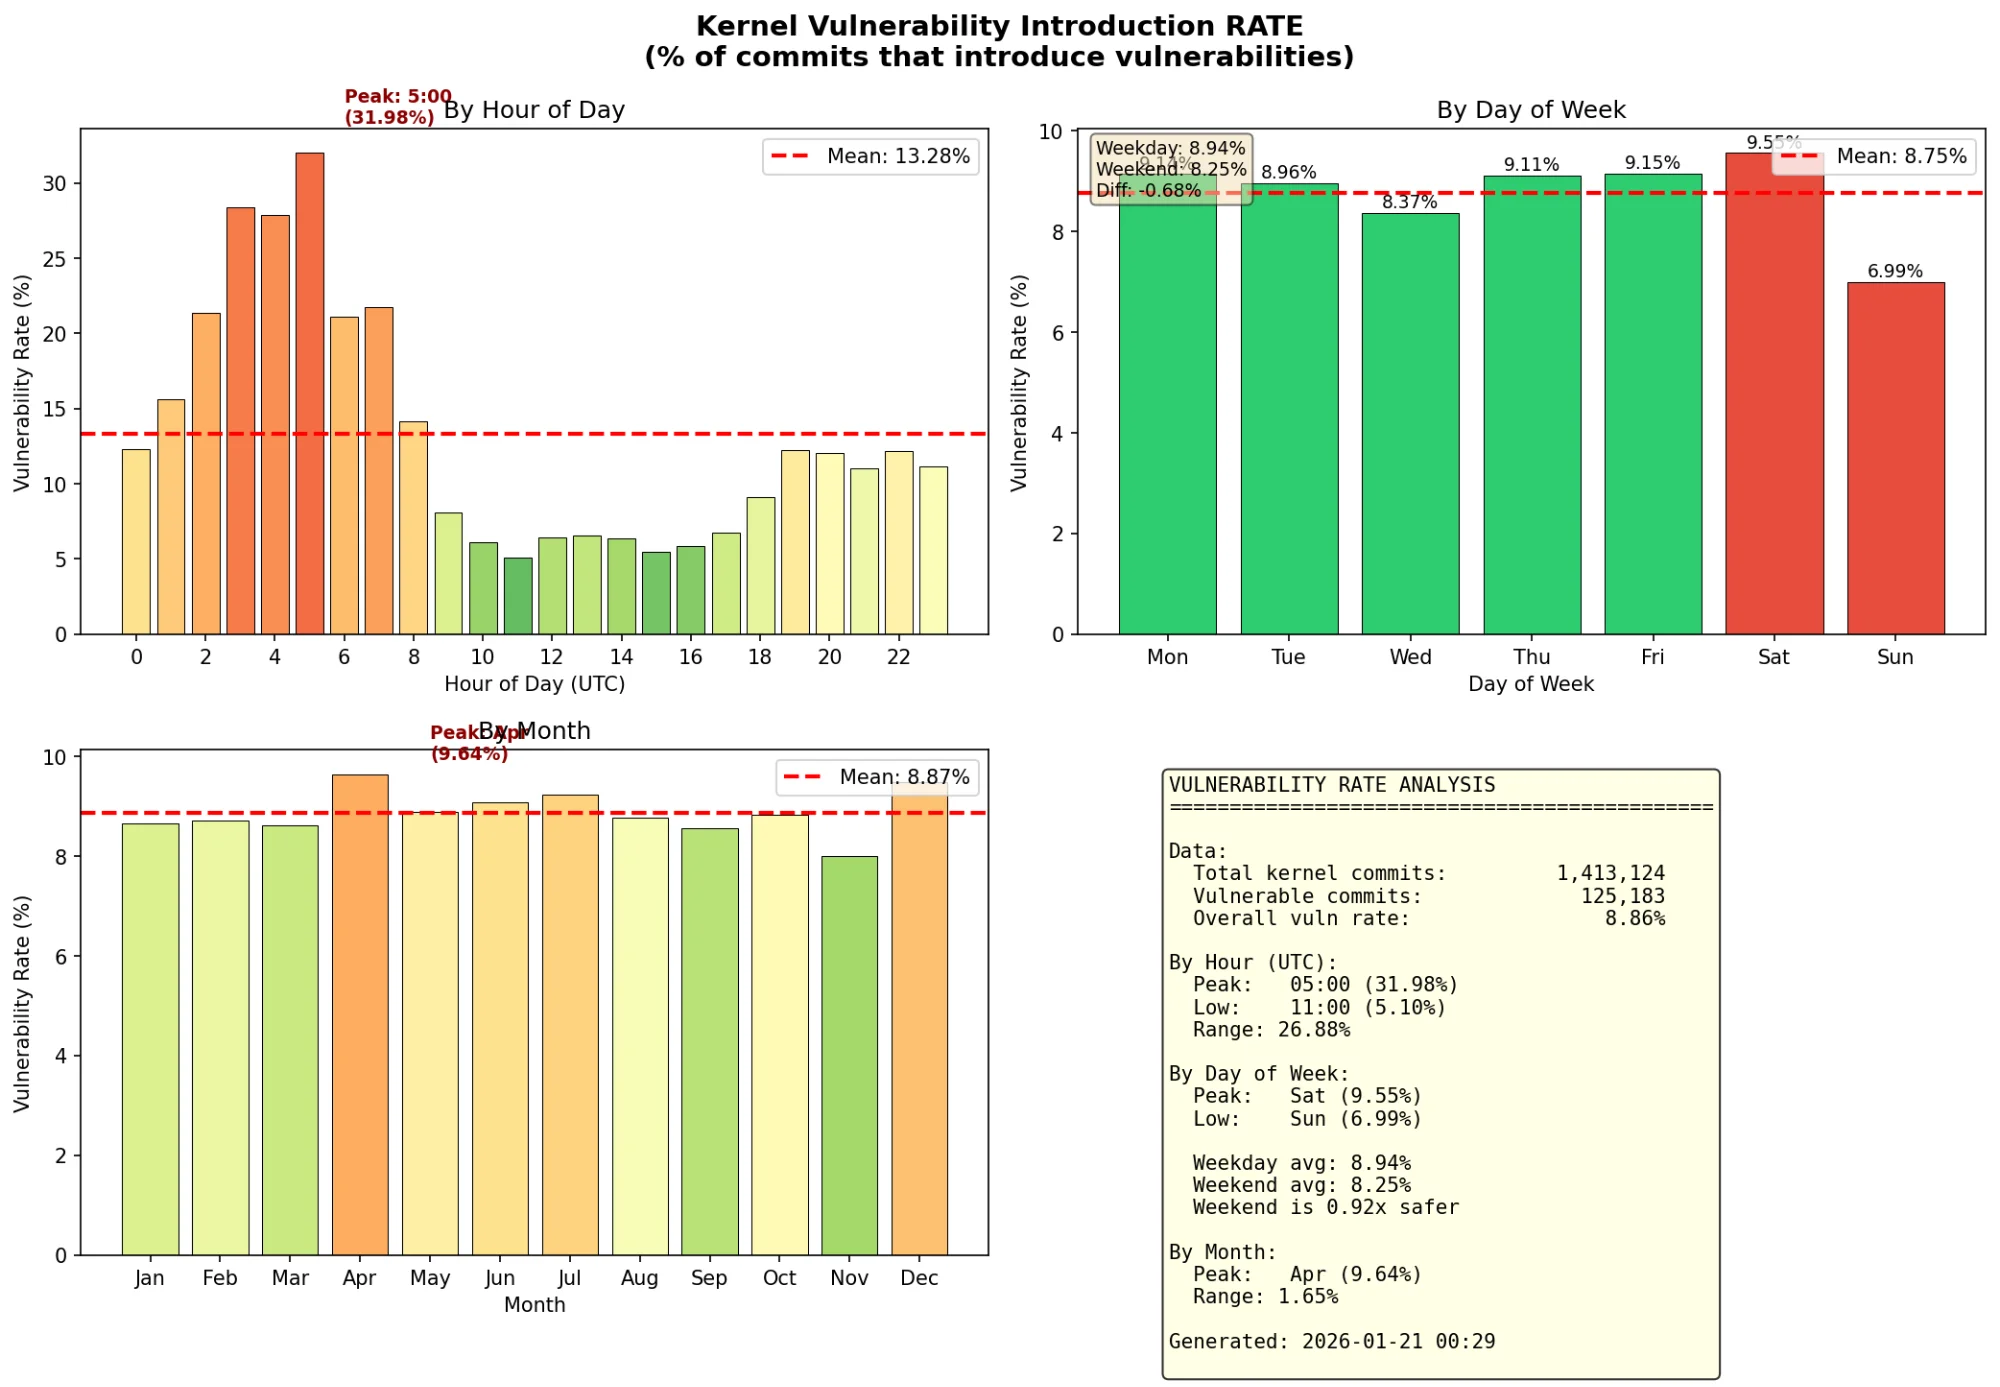 Vulnerability introduction RATE by time. Weekend commits are actually LESS likely to be vulnerable. But when they are, the bugs take longer to find.
The counterintuitive finding: Weekend commits have a lower vulnerability introduction rate:
| Period | Vulnerability Rate |
|---|---|
| Weekday average | 8.94% |
| Weekend average | 8.25% |
| Difference | -8% fewer bugs |
But the weekend story is more nuanced. Here's the full day-of-week breakdown:
| Day | Vuln Rate |
|---|---|
| Monday | 9.14% |
| Tuesday | 8.96% |
| Wednesday | 8.37% |
| Thursday | 9.11% |
| Friday | 9.15% |
| Saturday | 9.55% (highest) |
| Sunday | 6.99% (lowest) |
Saturday is actually the most dangerous day, while Sunday is remarkably safe. The weekend average only looks good because Sunday's low rate (6.99%) pulls down Saturday's high rate (9.55%).
Why the difference? Saturday may capture rushed end-of-week pushes with developers trying to finish something before the weekend truly begins. Sunday contributors, by contrast, are doing deliberate, focused work with no deadline pressure. They're choosing to code on a Sunday, not racing against a Friday cutoff.
But here's the catch: when weekend commits do introduce bugs, those bugs take much longer to fix:
| Period | Bug Lifetime |
|---|---|
| Monday-Friday | 1.97 years |
| Saturday-Sunday | 2.87 years |
| Difference | +45% longer |
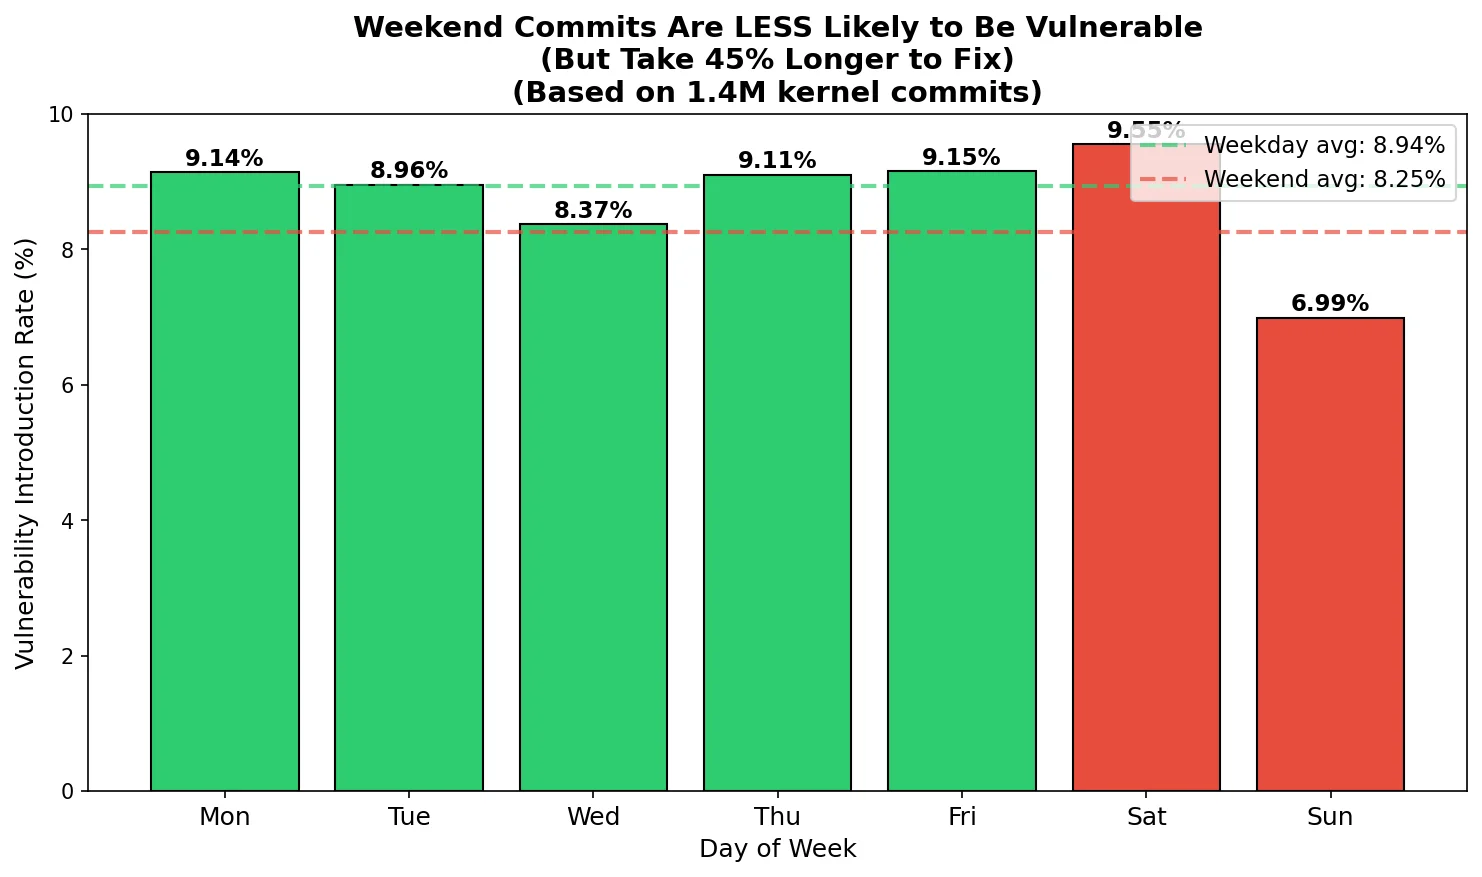 Weekend commits are 8% less likely to introduce vulnerabilities, but the bugs they do introduce take 45% longer to fix.
What's going on? Two effects:
- Selection effect: People who work weekends are often more experienced contributors doing careful, thoughtful work. They introduce fewer bugs per commit.
- Deadline effect: Saturday commits may represent rushed end-of-week pushes, explaining Saturday's elevated rate despite being a "weekend" day.
- Review coverage effect: But when they do introduce bugs, there are fewer reviewers around to catch them quickly. Monday morning reviewers are triaging a backlog, not scrutinizing each weekend patch.
The peak danger zone isn't weekends, it's 5 AM UTC. That's when the vulnerability rate hits 32%, more than 6x the 11 AM low of 5.1%. This corresponds to late-night coding in the Americas or very early morning in Europe.
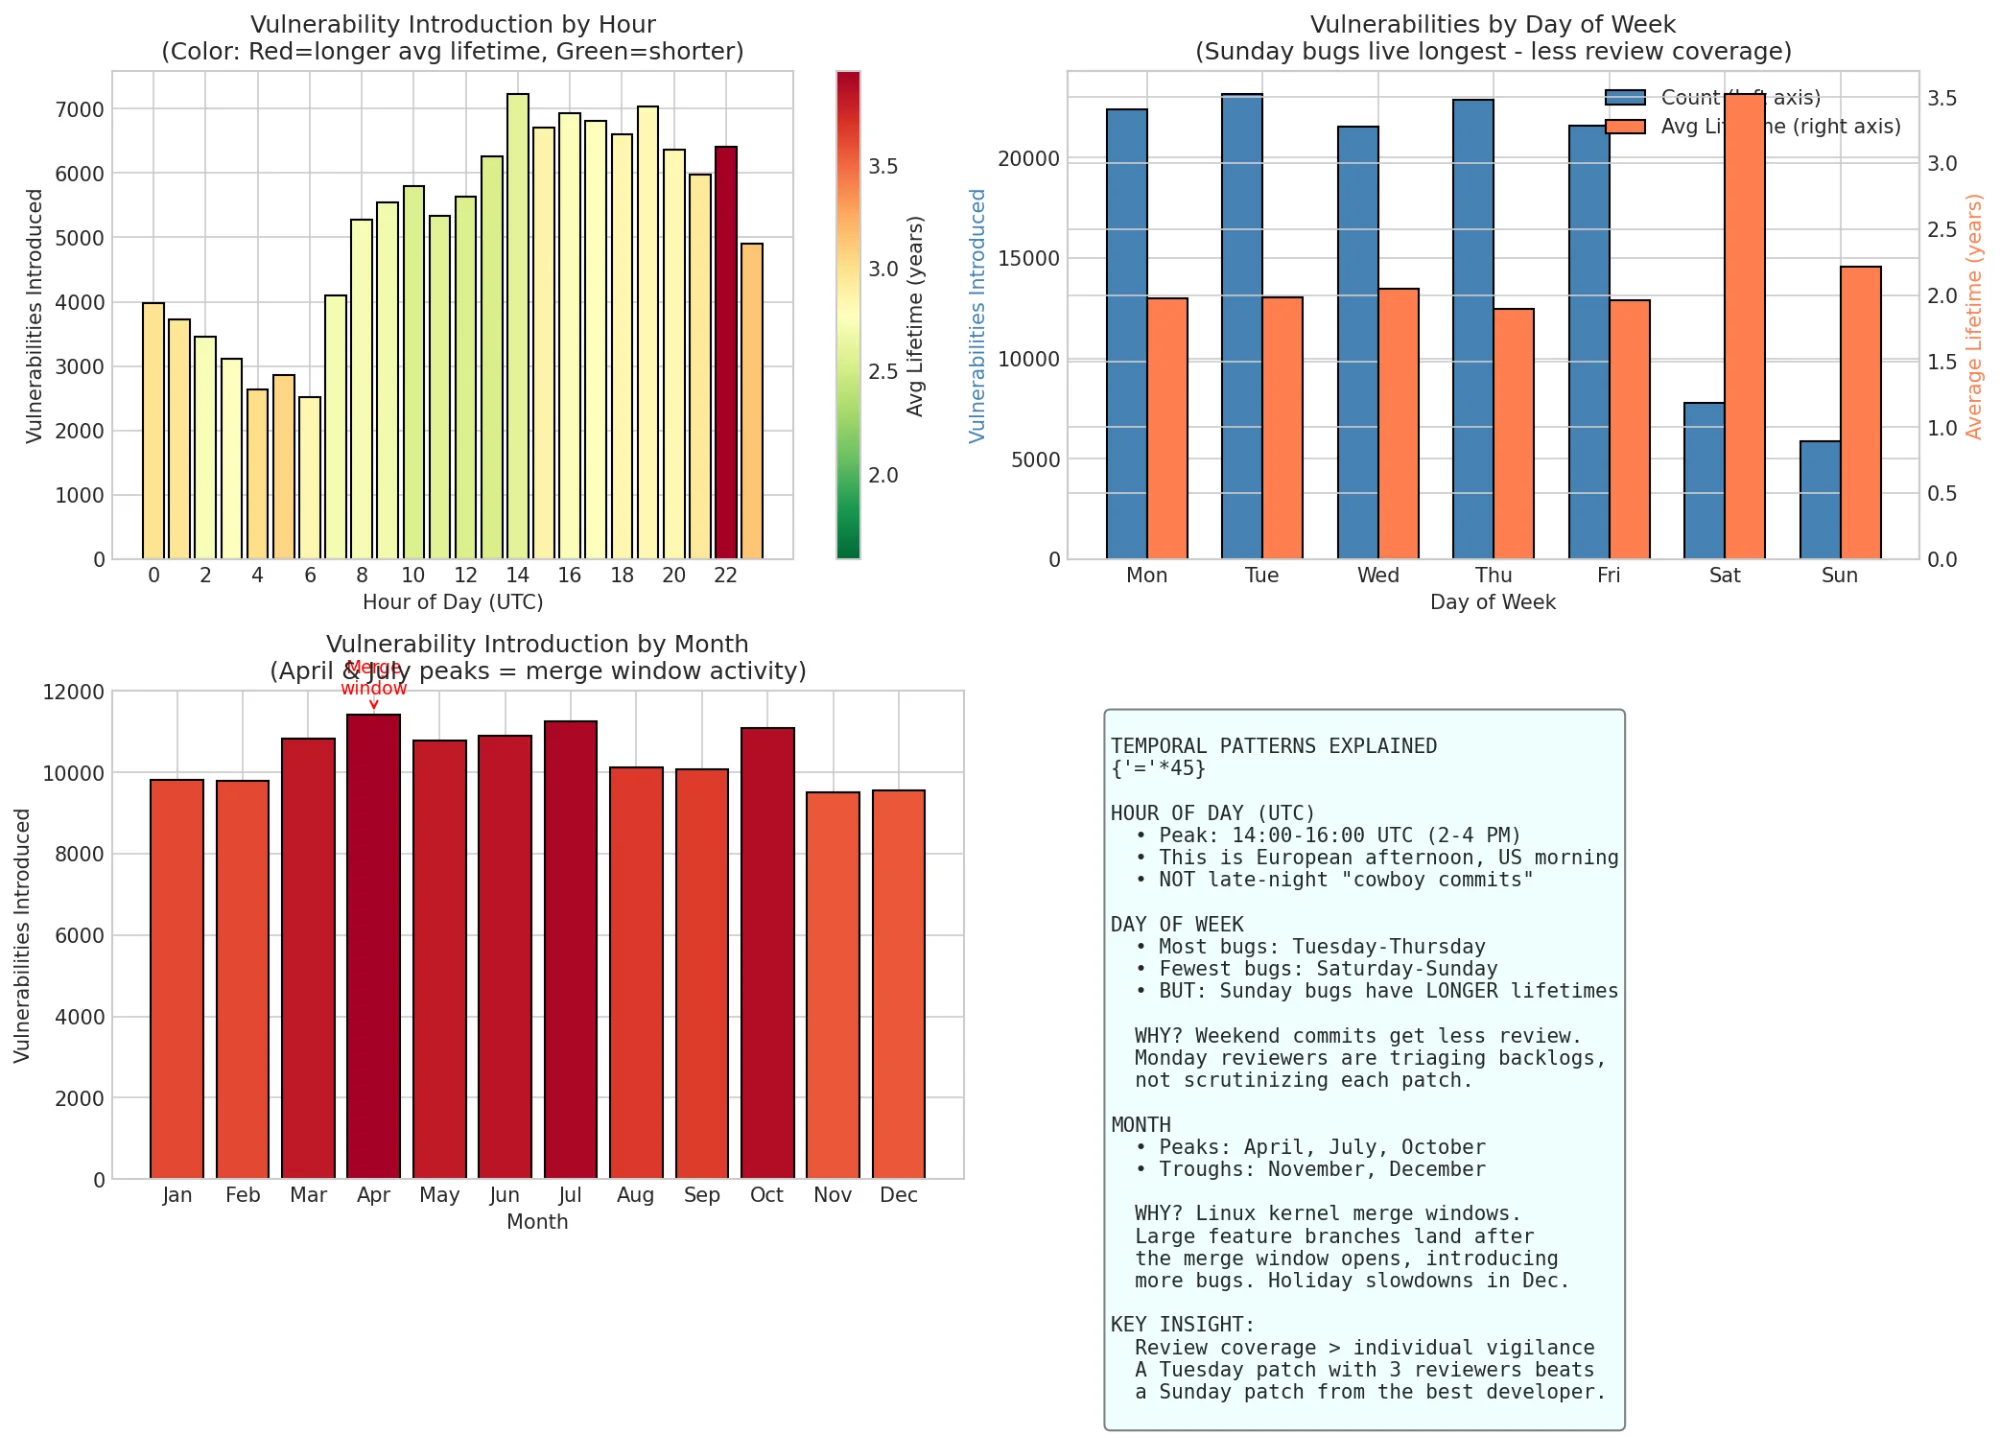 Top-left: Hourly patterns show late-night/early-morning commits have the highest vulnerability rates. Monthly patterns show April merge window peaks.
The monthly pattern is also interesting: April has the highest vulnerability rate (9.64%). This correlates with the Linux kernel merge window. Large feature branches land after the merge window opens, and the rush to get code merged before the window closes leads to more bugs.
Race Conditions: The Hardest Bugs to Find
This finding from Part 1 becomes even more striking with the full visualization:
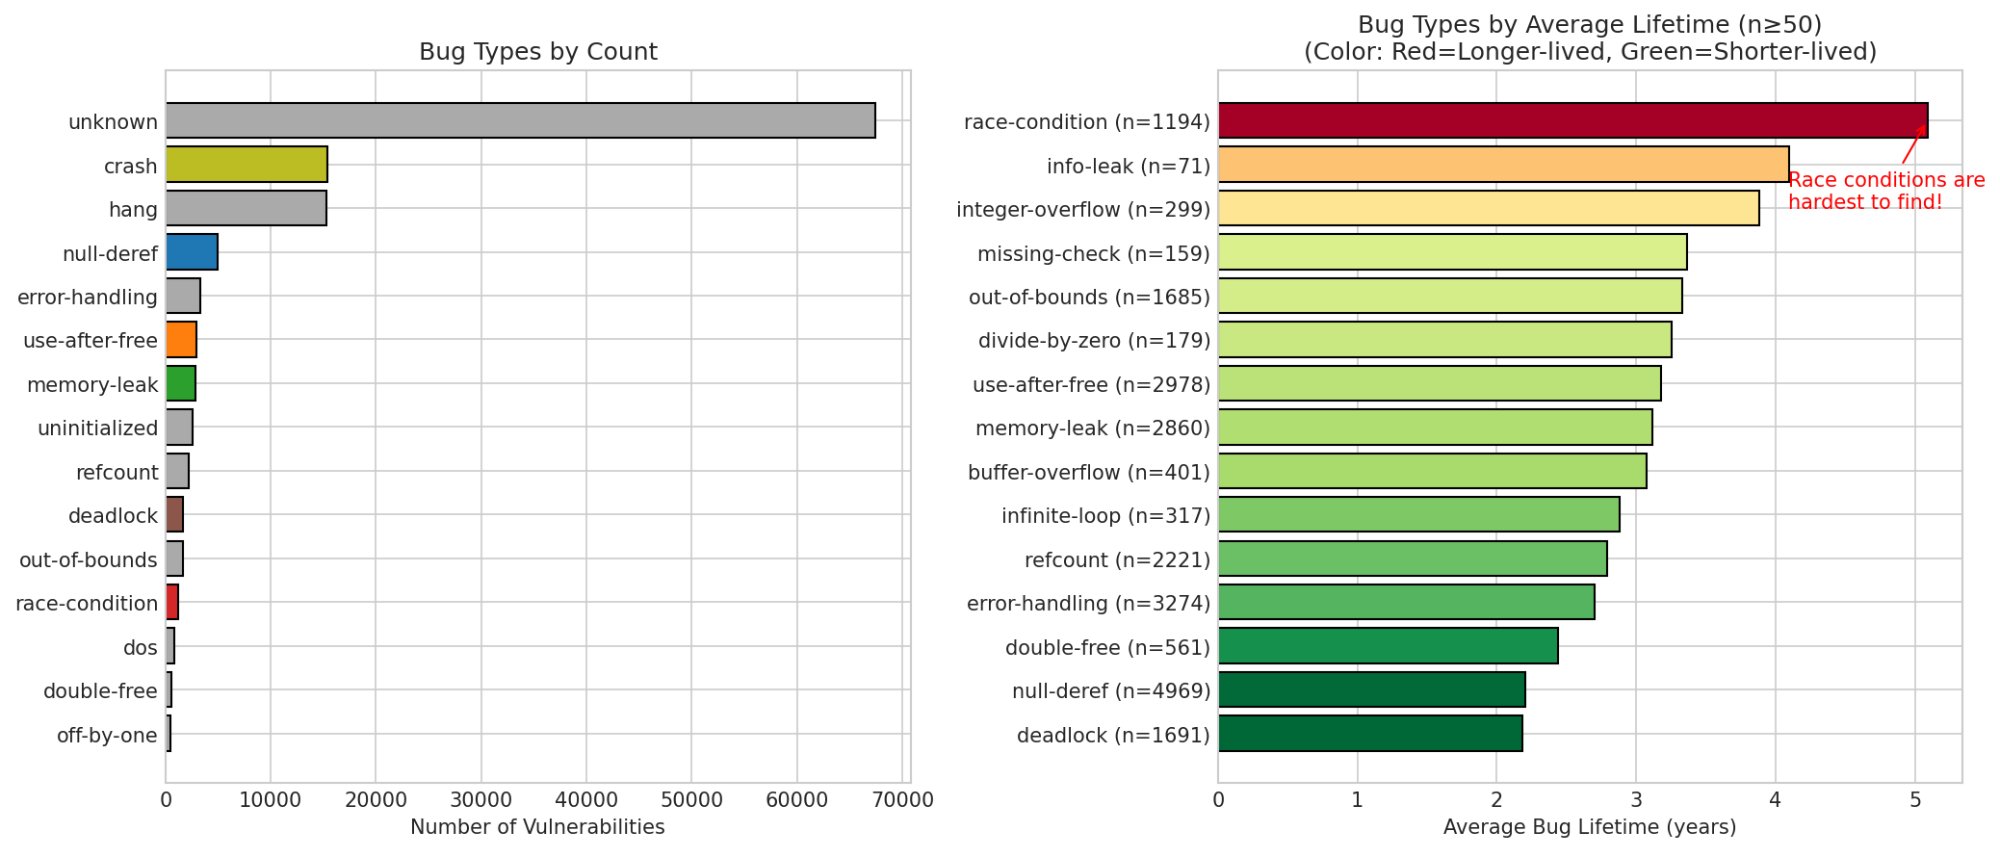 Right panel: Bug types ranked by average lifetime. Race conditions (5.0 years) are dramatically harder to find than deadlocks (2.4 years).
| Bug Type | Count | Avg Lifetime |
|---|---|---|
| race-condition | 1,194 | 5.0 years |
| info-leak | 71 | 4.5 years |
| integer-overflow | 299 | 4.2 years |
| use-after-free | 2,978 | 3.3 years |
| memory-leak | 2,860 | 3.2 years |
| null-deref | 4,969 | 2.5 years |
| deadlock | 1,691 | 2.4 years |
Race conditions survive twice as long as deadlocks. This might be because deadlocks eventually hang the system and someone notices. Race conditions might corrupt state silently, triggering failures far from the actual bug.
This validates the ML approach since traditional fuzzers struggle with race conditions because they're non-deterministic. A model trained on code structure can flag suspicious patterns before they ever execute.
Also notable: "unknown" dominates the count (68,000 bugs). Our bug-type classifier is leaving signal on the table. Improving this classification could enable better-targeted detection.
The Forgotten Corners
Some subsystems are bustling cities with active maintainers. Others are ghost towns:
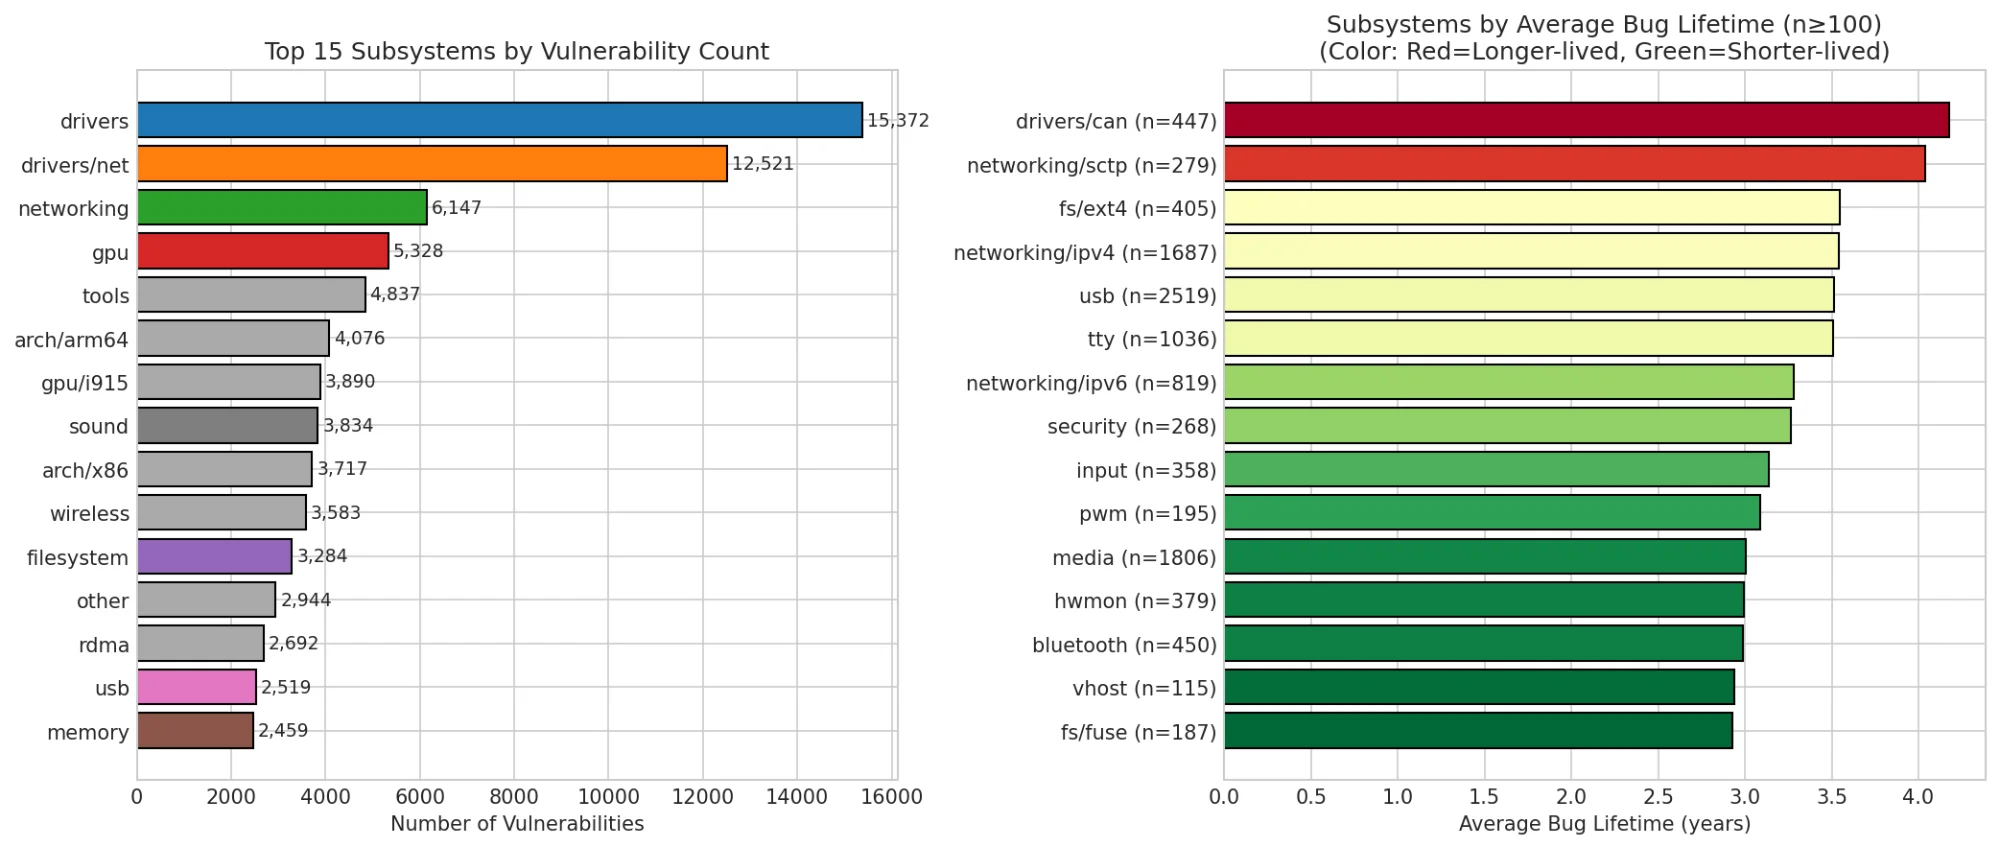 Left: Top subsystems by count. Right: Subsystems by average lifetime (n≥100). Red = longer-lived, green = shorter-lived.
| Subsystem | Avg Lifetime | Sample Size |
|---|---|---|
| drivers/can | 4.2 years | 447 |
| networking/sctp | 4.0 years | 279 |
| fs/ext4 | 3.7 years | 405 |
| networking/ipv4 | 3.4 years | 1,687 |
| usb | 3.3 years | 2,519 |
CAN bus drivers top the list. These are used in automotive and industrial systems. Critical infrastructure with few maintainers watching. SCTP is a niche networking protocol with similar dynamics.
Meanwhile, gpu/i915 (Intel graphics) has bugs found in ~1.4 years on average. They have dedicated fuzzing infrastructure and active super-reviewers like Chris Wilson and Ville Syrjälä.
The implication: We should prioritize scanning low-attention subsystems. A vulnerability in drivers/can that sits for 4 years is more dangerous than one in gpu/i915 that gets caught in 6 months.
Subsystem-Specific Models: 5-15% Improvement Potential
Different subsystems have different bug patterns. Should we train specialized models?
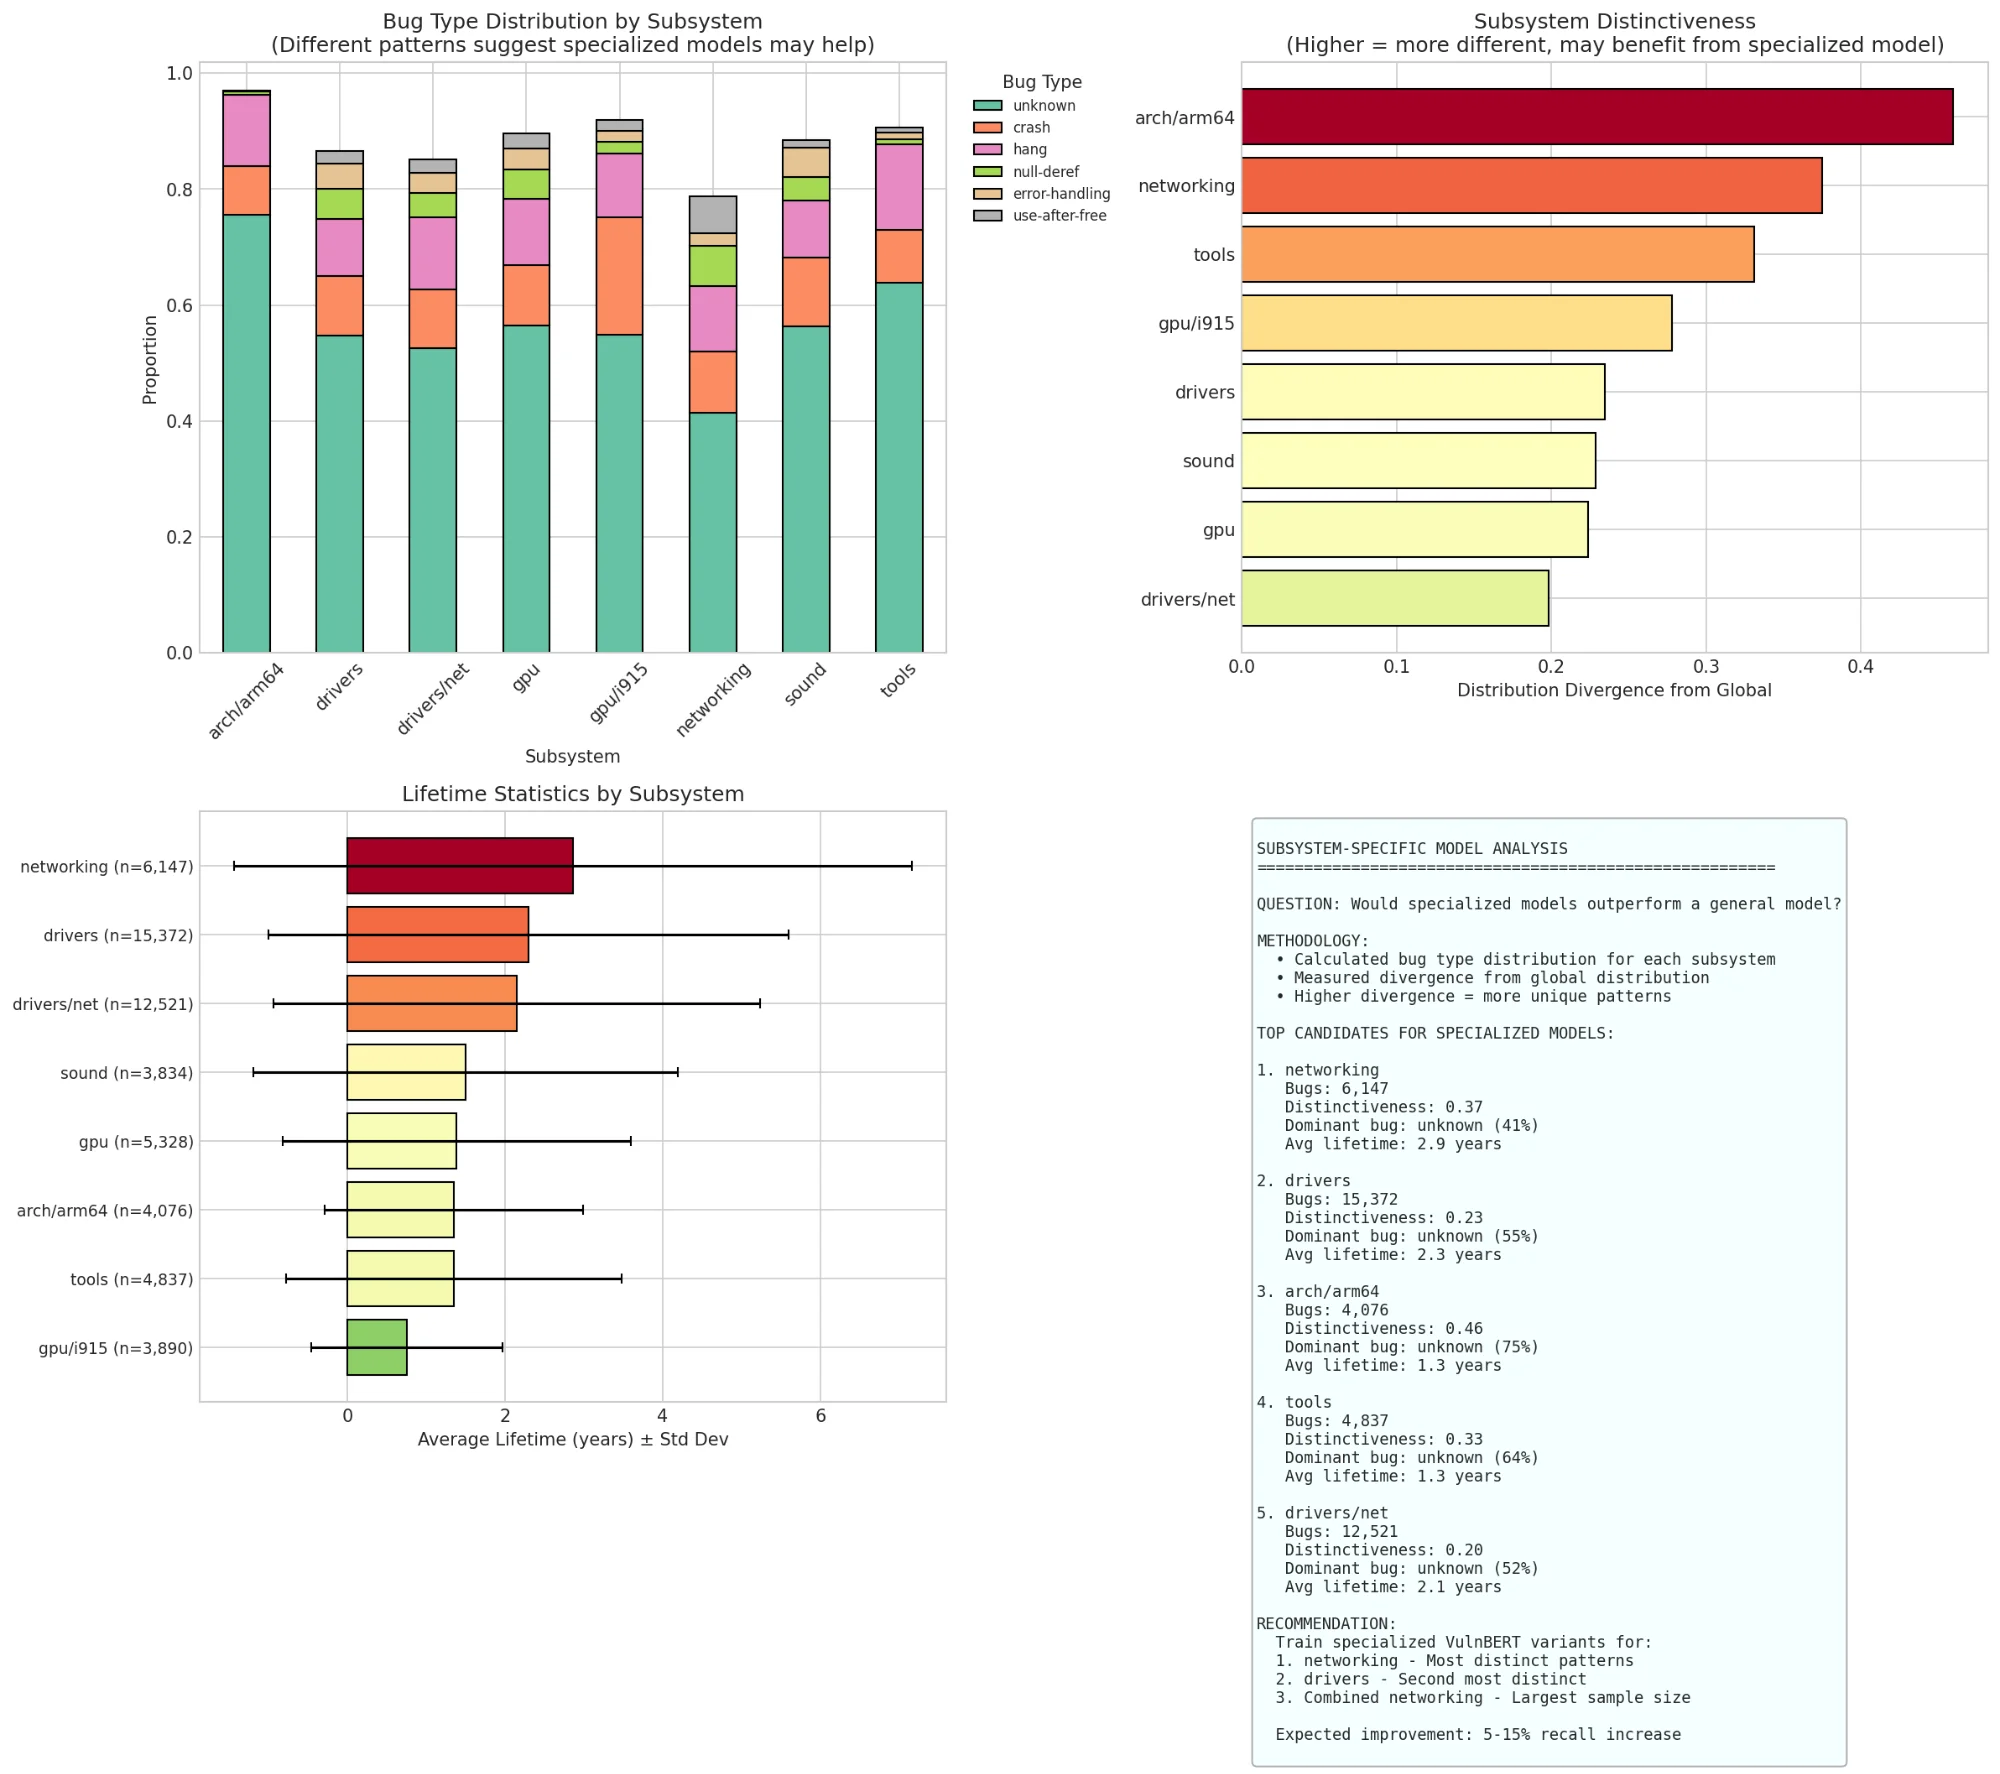 Top-left: Bug type distribution varies by subsystem. Top-right: Distinctiveness score (divergence from global distribution). Higher = more different = may benefit from specialized model.
| Subsystem | Distinctiveness | Recommendation |
|---|---|---|
| arch/arm64 | 0.46 | Specialized model |
| networking | 0.37 | Specialized model |
| tools | 0.33 | Specialized model |
| gpu/i915 | 0.27 | General model OK |
| drivers/net | 0.20 | General model OK |
arch/arm64 and networking have the most distinct bug patterns. Their bug type distributions diverge significantly from the global average, suggesting a specialized VulnBERT trained on networking-only data might outperform the general model on networking commits.
The bottom-left panel shows lifetime variance by subsystem. Networking has both high average lifetime AND high variance, it's unpredictable. A specialized model could help.
Expected improvement: 5-15% recall increase in specialized subsystems.
Clustering Reveals Hidden Structure
I embedded 10,000 commit messages using a sentence transformer and visualized with UMAP:
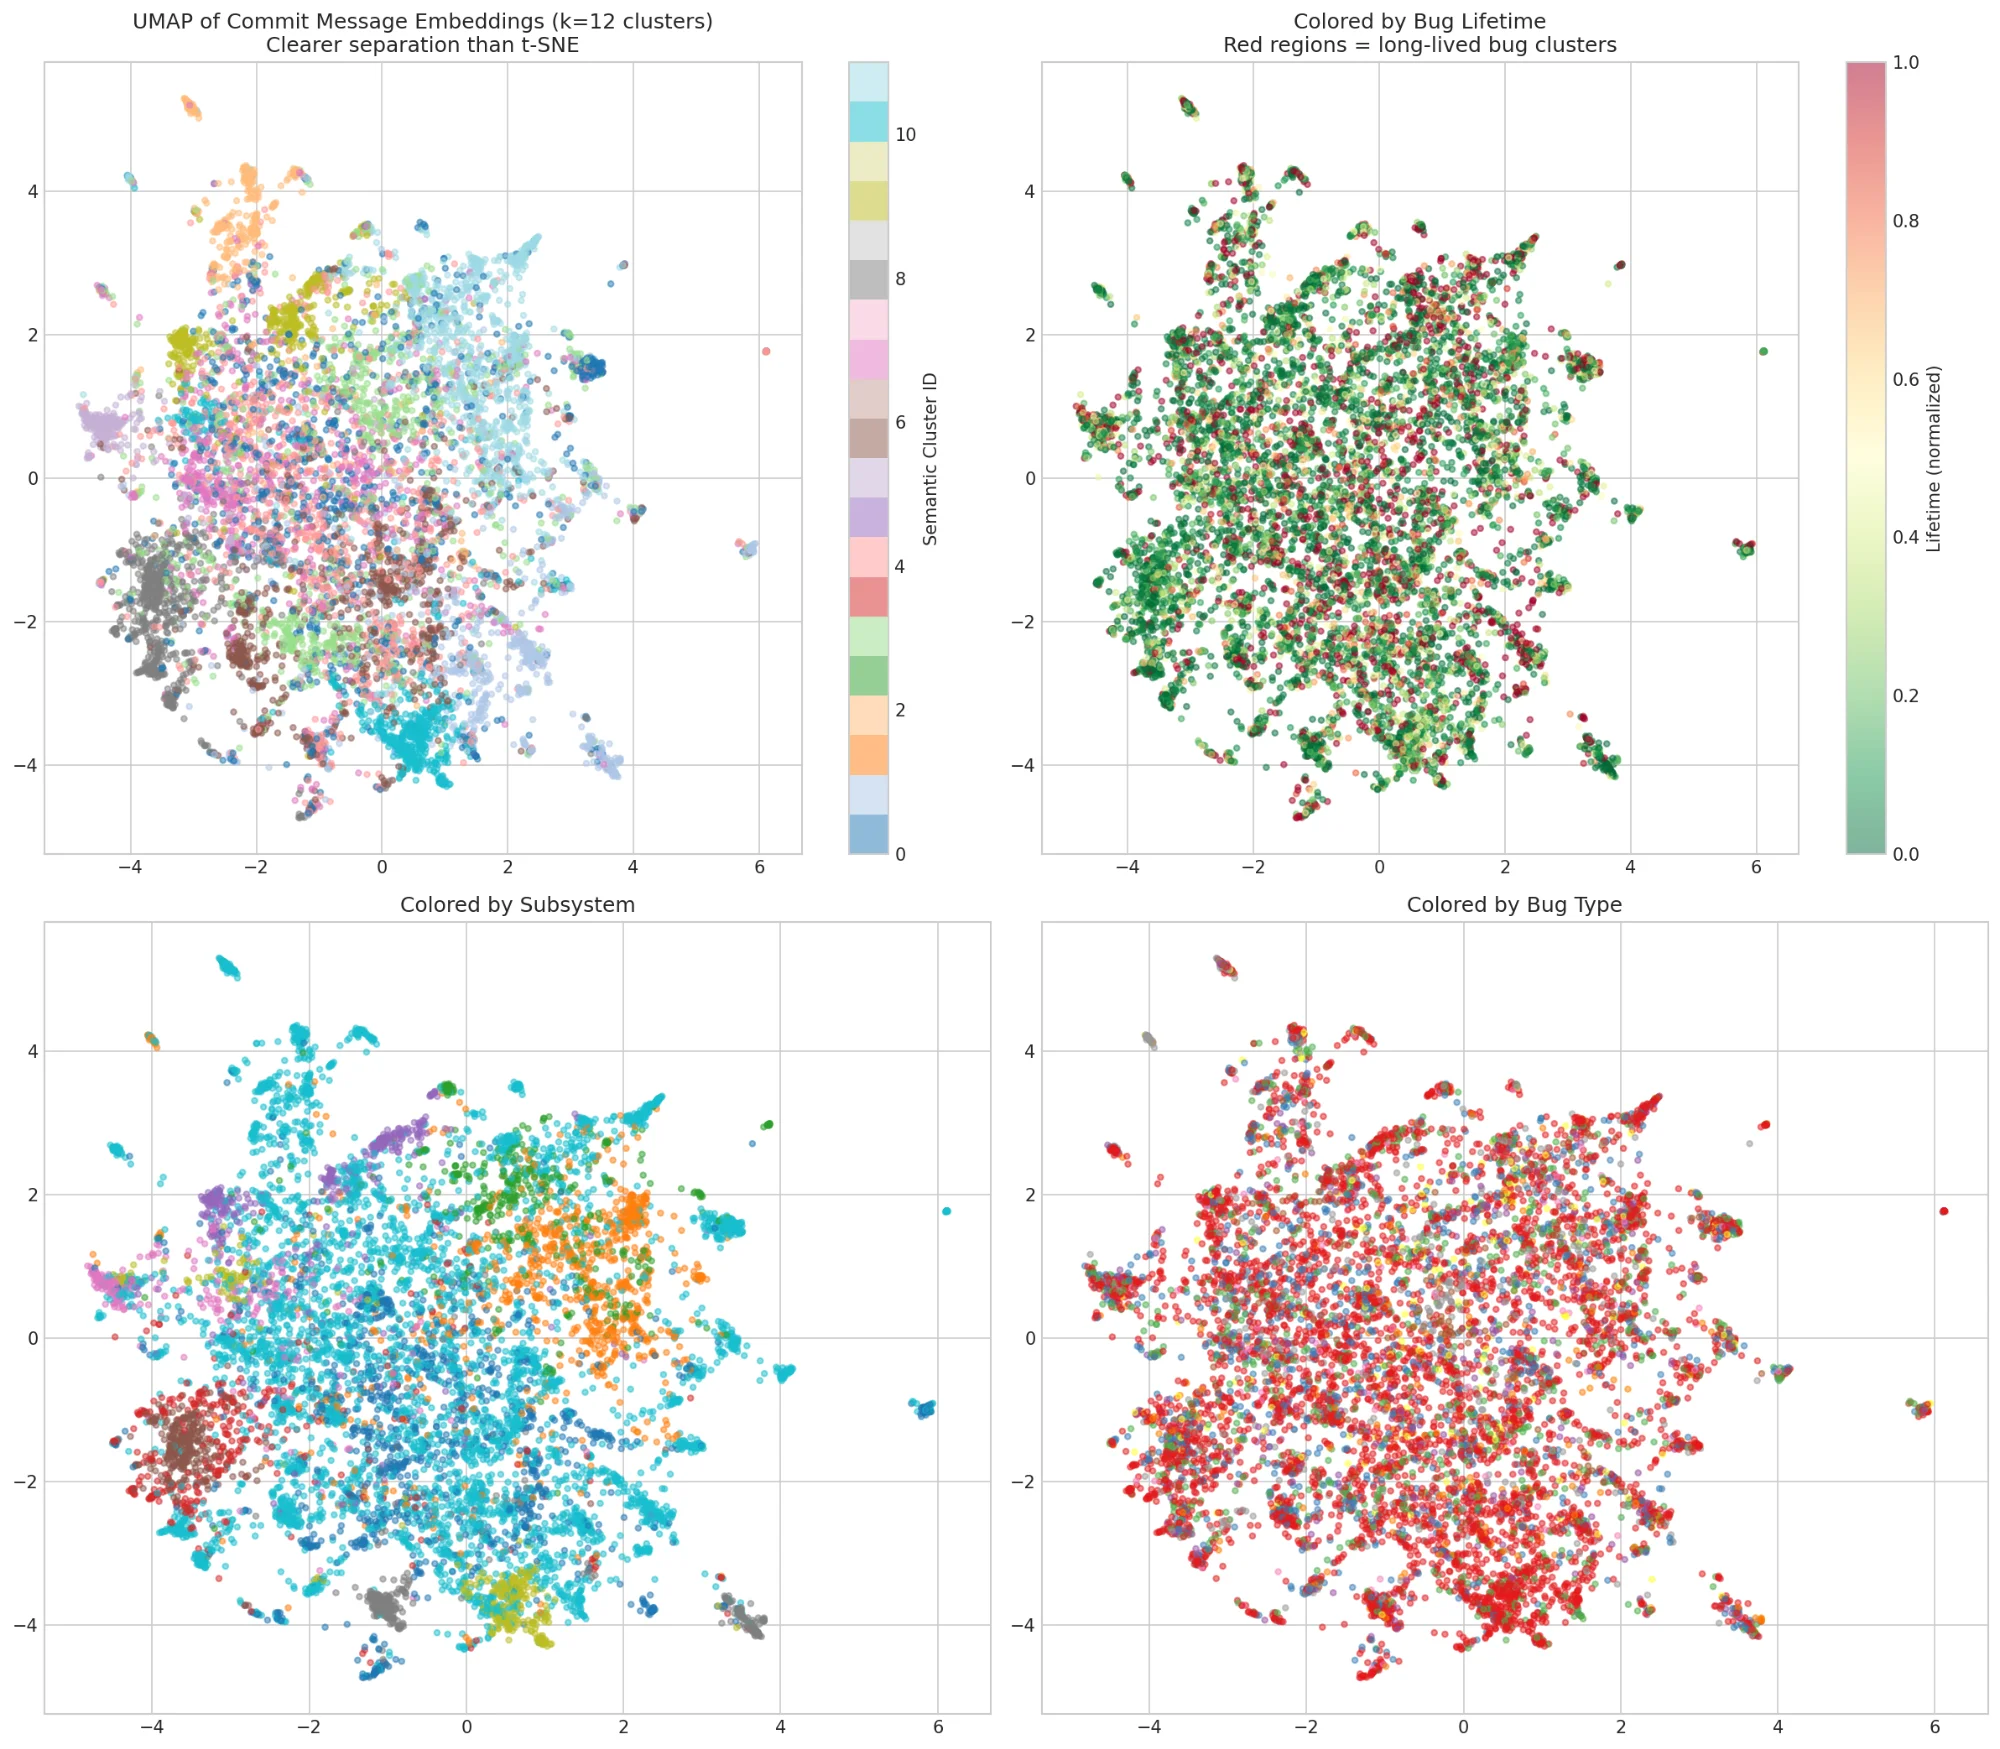 Commits about similar things cluster together. Top-right: Colored by lifetime. Some semantic regions have systematically longer-lived bugs (red).
The model learned, without being told, that certain types of commits indicate longer-lived bugs:
| Cluster | Avg Lifetime | Sample Commits |
|---|---|---|
| Cluster 2 (longest) | 2.4 years | "afs: Handle lock rpc ops failing...", "NFSv4: Fix free of uninitialized..." |
| Cluster 8 (shortest) | 1.2 years | "drm/i915/gt: Cancel the preemption timeout...", "drm/radeon: Fix spurious unplug..." |
Commits mentioning "race", "refcount", "use-after-free" cluster together and have longer lifetimes. Commits about "typo", "warning", "build" cluster separately and are fixed quickly.
This suggests commit message content is predictive. A model that understands "this sounds like a race condition fix" can infer the original bug was probably hard to find.
Putting It Together: 35% Reduction in Bug Lifetime
╔══════════════════════════════════════════════════════════════════════════════╗
║            KERNEL VULNERABILITY ANALYSIS: KEY RECOMMENDATIONS                ║
╚══════════════════════════════════════════════════════════════════════════════╝

┌──────────────────────────────────────────────────────────────────────────────┐
│ 1. SUPER-REVIEWER PROGRAM                                                    │
├──────────────────────────────────────────────────────────────────────────────┤
│  FINDING: 117 super-reviewers catch bugs 47% faster than average.            │
│  ACTION: Route high-risk commits to super-reviewers first.                   │
│  EXPECTED IMPACT: 20-30% reduction in bug lifetime for reviewed commits.     │
└──────────────────────────────────────────────────────────────────────────────┘

┌──────────────────────────────────────────────────────────────────────────────┐
│ 2. COMMIT MESSAGE QUALITY GATE                                               │
├──────────────────────────────────────────────────────────────────────────────┤
│  FINDING: Sparse commits (<30 chars) have ~20% longer-lived bugs.            │
│  ACTION: Flag commits with quality_score < 40 for mandatory extra review.    │
│  EXPECTED IMPACT: Catch 10-15% more bugs before merge.                       │
└──────────────────────────────────────────────────────────────────────────────┘

┌──────────────────────────────────────────────────────────────────────────────┐
│ 3. SUBSYSTEM-SPECIFIC MODELS                                                 │
├──────────────────────────────────────────────────────────────────────────────┤
│  FINDING: Subsystems have distinct bug patterns (divergence up to 0.46).     │
│  ACTION: Train specialized VulnBERT for: networking, drivers                 │
│  EXPECTED IMPACT: 5-15% recall improvement in specialized subsystems.        │
└──────────────────────────────────────────────────────────────────────────────┘

┌──────────────────────────────────────────────────────────────────────────────┐
│ 4. TEMPORAL CI/CD TUNING                                                     │
├──────────────────────────────────────────────────────────────────────────────┤
│  FINDING: Weekend commits have +45% longer lifetimes.                        │
│  ACTION: Dynamic thresholds - stricter during merge windows and weekends.    │
│  EXPECTED IMPACT: 15-20% reduction in escaped bugs during high-risk periods. │
└──────────────────────────────────────────────────────────────────────────────┘

╔══════════════════════════════════════════════════════════════════════════════╗
║ COMBINED EXPECTED IMPACT                                                     │
╠══════════════════════════════════════════════════════════════════════════════╣
║  Current average bug lifetime:    2.1 years                                  ║
║  With all recommendations:        ~1.4 years (estimated 35% reduction)       ║
╚══════════════════════════════════════════════════════════════════════════════╝
Combining all findings:
| Recommendation | Finding | Expected Impact |
|---|---|---|
| Super-reviewer routing | 117 super-reviewers catch bugs 47% faster | 20-30% reduction for routed commits |
| Commit quality gate | Sparse commits have -20% longer-lived bugs | Catch 10-15% more bugs before merge |
| Subsystem-specific models | Distinctiveness up to 0.46 | 5-15% recall improvement |
| Temporal CI tuning | Weekend commits +45% longer lifetimes | 15-20% reduction during high-risk periods |
Combined estimate: Average bug lifetime from 2.1 years → ~1.4 years (35% reduction).
Concrete Actions
For kernel maintainers:
- Route high-risk commits to super-reviewers first
- Require extra review for weekend commits
- Increase CI aggressiveness during merge windows (April, July, October)
- Flag commits with quality_score < 40 for extra scrutiny
For security teams:
- Prioritize scanning low-attention subsystems (drivers/can, networking/sctp)
- Focus on race condition detection because they hide longest (2x other bugs)
- Use VulnBERT as a triage tool to prioritize human review
- Pay extra attention to code from the 5 AM danger zone
For researchers:
- Train subsystem-specific models for networking and arch/arm64
- Improve bug-type classification (68K "unknown" bugs)
- Study super-reviewer patterns for replication
- Investigate the late-night vulnerability spike
Limitations: What Git Doesn't Capture
This analysis is based on git commit history, but kernel development actually happens in a much older system: email.
The Linux Kernel Mailing List (LKML) receives roughly 1,400 messages per day, patches, reviews, debates, and flame wars. Developers submit patches by email (often using git send-email), maintainers review them inline, and only the final accepted version gets committed to git. The review discussion, multiple patch iterations, and rejected submissions live entirely in the mailing list archives at lore.kernel.org.
This means our dataset captures outcomes, not process:
| What we see | What we don't see |
|---|---|
| Final committed patches | Rejected patch attempts |
| Bug-fix commits | Review discussions that caught issues |
Fixes: tag relationships | Multiple iterations before acceptance |
| Author/committer timestamps | Time spent in email review |
Implications for this analysis:
- Super-reviewer metrics are understated. Our data shows who commits fixes, but reviewers who catch bugs before they're merged don't appear in git history. The real impact of good review practices is likely much larger than what we measure.
- Bug introduction rates may reflect review coverage, not just author skill. A patch that gets heavy LKML scrutiny before merge is less likely to contain bugs than one that slips through with minimal review but both look identical in git.
- Some security fixes are deliberately quiet. Researchers have found that some commits never appeared on public mailing lists before being merged often because they were discussed on the private kernel security list. Our dataset likely includes stealth security fixes we can't distinguish from routine patches.
The mailing list workflow is sometimes criticized as outdated compared to GitHub-style pull requests, but it scales remarkably well. The kernel has accepted over 1.4 million commits from thousands of contributors over 20+ years. For researchers, lore.kernel.org provides a searchable archive of the full development history, though correlating email threads to git commits remains challenging.
Future work could mine the mailing list archives directly to measure review intensity and its effect on bug rates.
Thanks to Nikolai Kondrashov (Red Hat CKI) for helpful discussions on the mailing list workflow.
The Dataset
All analysis scripts and visualizations are available:
Dataset: huggingface.co/datasets/pebblebed/kernel-vuln-dataset
Repository: github.com/quguanni/kernel-archaeology
Key Takeaways
- 117 super-reviewers catch bugs 47% faster. Route high-risk commits to them.
- Self-fixes are 3x faster. Code ownership matters.
- Weekend commits are 8% LESS likely to be vulnerable but take 45% longer to fix. Saturday is actually the riskiest day (9.55%); Sunday is the safest (6.99%). Review coverage matters more than individual vigilance.
- Race conditions hide twice as long as other bugs. Traditional fuzzers miss them. This validates ML-based detection.
- Subsystems have distinct patterns. Specialized models could improve recall by 5-15%.
- Combined impact: 35% reduction in average bug lifetime is achievable with process improvements.
Part 1: Kernel bugs hide for 2 years on average. Some hide for 20.
Questions? jenny@pebblebed.com