Depression Babies: The AI That Still Hasn't Gotten Over the Great Depression
AbstractWe trained small transformers from scratch on a century of daily US market data, keeping everything the same except the era each one grew up on, and then gave all of them the same later training. Out of sample, on 2006 to 2026, the models raised on the Depression put 1.30 times as much probability on a 3% drop on calm days as the models raised on the postwar boom, and about half of that gap survived the later training. The difference sits in their beliefs about rare extreme days rather than in their overall mood. Around that result we tested a number of widely held claims about plasticity, RL post training, LoRA, quantization, data poisoning and data order.
Keywordspretraining, data order, continual learning, plasticity, RL post training, data poisoning, calibration, markets, preregistration
12 sections · 3153 words
People who came of age in the Great Depression were still holding less stock decades later, long after the market had recovered. Ulrike Malmendier and Stefan Nagel documented this in a paper called Depression Babies.
That sounded to me like a claim about learning, and it's one ML hasn't settled either. The standard recipe is to pretrain on whatever you can scrape, finetune on the good stuff, maybe run RL on top, and trust that the model mostly believes whatever it saw last. Catastrophic forgetting is the usual evidence for that trust. Work on critical learning periods and the primacy bias in RL points the other way, toward first impressions that stick. I couldn't find much about how many of a model's beliefs still trace back to its pretraining data after a full round of finetuning.
People are hard to experiment on, since you can't rerun someone's childhood with a different decade in it. Networks don't mind. So the plan was to raise networks on different eras of market history, send them all through identical later training, and see whether the ones raised on the Depression still flinched.
I picked markets because by four the next afternoon the market tells you how you did, the daily data goes back to 1926,1 and the eras have wildly different personalities. Language models would have been the fashionable choice, but there's no answer key for what a language model believes and no clean way to swap out what it read first. We ended up raising 1,510 small transformers.
The Depression kids are still scared.
The experiment
Every model is the same small transformer, about 124,000 parameters. It reads the last 128 trading days of returns for the US market and twelve industry portfolios (all from Kenneth French's data library) and outputs a probability distribution for tomorrow's returns, a blend of four bell curves, so you can ask it the chance of any size of move.
- Pretraining, one era per model, 5,022 trading days each:
- Depression babies: July 1926 to 1943
- Boom babies: 1946 to 1965
- Stagflation babies: 1966 to 1985
- Finetuning: 1986 to 2001
- Validation (all tuning): 2002 to 2005
- Out of sample test (held back and opened once, at the end): 2006 to August 2026
A 3% drop happened about once every six weeks in the Depression era and about once a year in the boom, so the two groups grew up in very different households.
The main comparison is between twins. Each Depression baby has a boom twin trained from the same random seed, so the only difference between them is the era they grew up in. If finetuning really wipes the slate, the twins should agree out of sample. Whatever difference is left, we called the scar. The main result uses 24 twin pairs.
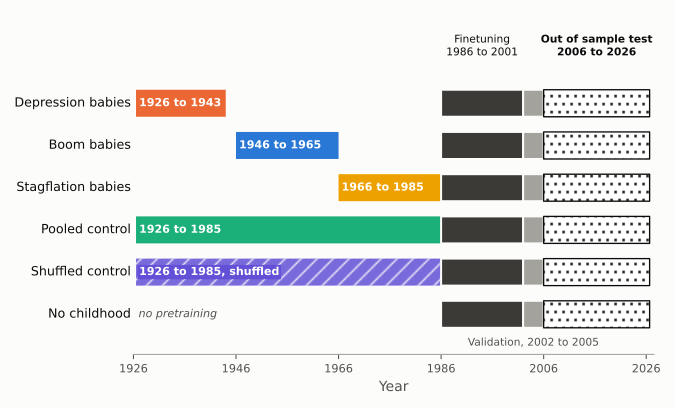
What we measured
Comparing the twins on a random day doesn't work well. The models read recent returns, so after a rough month both of them are nervous and the difference gets drowned out.
So we used calm days, when trailing 20 day volatility was in the bottom quartile of the finetuning period. The test period has 1,062 of them.
Then there was the question of which belief to look at. The inputs are scaled by recent volatility, so a childhood in a wilder market can't make a model expect more volatility in general. What it can change is how often the model thinks extreme days show up relative to normal ones. We checked this on a synthetic market first. The models shrugged off a built in difference in overall volatility and picked up a built in difference in how often extreme days happen.
The main test, which we wrote down before looking at the test years, compared the probability each Depression twin puts on a 3% drop on calm test days with its boom twin's.
The main result
On calm test days the Depression babies put a 0.119% chance on a 3% drop, and their boom twins put it at 0.091%, a ratio of 1.30. The 95% interval across the 24 twin pairs runs from 1.18 to 1.45. That's about three times the smallest gap we'd said in advance would count, and after correcting for running six tests at once, the p value is 0.00005.
I was hoping for more. On the validation years the ratio was 1.66, and I'd already started drafting a headline with an exclamation point in it. The scar is small in absolute terms too: over 1,062 calm days it adds up to about a third of one extra expected crash day.
Five of those calm days did fall more than 3%, four to five times what either twin expected. So both twins were too calm, and the more scared ones were closer, though five days isn't much to go on.
Malmendier and Nagel's actual question was how much stock people held, so we asked the twins the same thing. We trained an identical RL investing policy on top of each one. The Depression babies' policy held 55.5% in stocks and the boom babies' held 55.3%, which is no real difference. The scar is in what they believe about rare bad days, not in how much stock they hold.
It's in the tail
For a drop of 3% or more, the Depression babies are 1.30 times as worried as their twins.
The ratio depends on how big a drop you ask about. At 1.5% the ratio is close to 1,2 and it climbs the further into the tail you go. Excess kurtosis, a standard measure of how heavy the tails are, is 1.49 for the Depression babies and 0.96 for the boom babies.
How much survives finetuning
For every 10,000 calm days, the Depression baby still expects about 5.8 more crash days than its twin at this point in training.
We tracked the twins' disagreement all the way through finetuning. For the first 500 of its 2,500 steps it didn't budge. Then over a third of it melted away by step 1,000, and after that it faded slowly. When finetuning ended 48% of the gap they arrived with was still there.
Two controls pretrained on all three eras pooled together, 1926 to 1985. The pooled control read those sixty years in order, Depression first. The shuffled control got the same years chopped into blocks and shuffled like a deck of cards, and came out about as calm as the boom babies.3
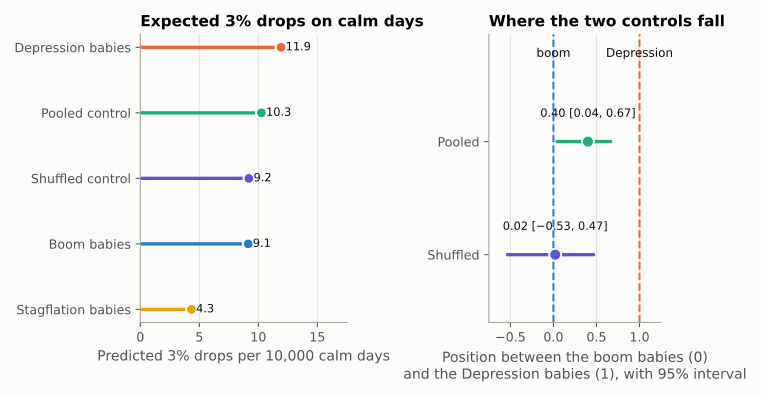
The pooled control landed between the twins: same returns as the shuffled one, different order, more fear left over, though see the footnote before leaning on that. The stagflation babies, who saw the fewest big down days of anyone, came out the calmest of all, about half as worried as the boom babies. A third control with no pretraining at all came out wildly overscared, about seven times as worried as the boom babies.
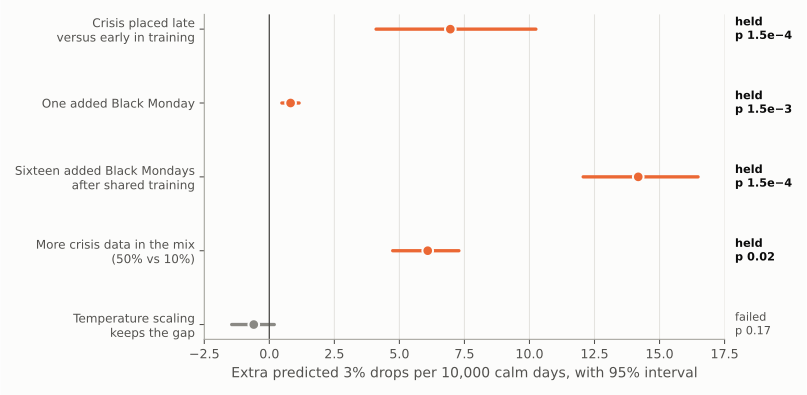
With a constant learning rate (the size of each training step), a crisis placed late in pretraining left a bigger scar than the same crisis placed early, on 16 of 16 seeds. With a cosine schedule, which eases the learning rate down to almost zero by the end, what mattered was whether the crisis arrived while the learning rate was still high, so late data counted for less.
Trying to remove it
We threw the standard forgetting toolkit at it, wrote down a success criterion for each method in advance, and measured how much of the twin gap was left afterwards.4
Pick a treatment to see how much of the scar it leaves.
First up were the plasticity methods, which are meant to keep a network able to learn new things: continual backprop, ReDo (which found no dormant neurons to reset), plasticity injection and L2 toward init. They left the scar about where it was.
What worked was moving the weights a long way. Shrink and perturb, which shrinks every weight and adds a little noise, removed almost all of it in one batch and overshot in another, leaving the Depression babies calmer than their boom twins. The cheapest fix was doubling the finetuning task vector, which means applying the change finetuning made to the weights twice. That removed about 89% of the scar and barely changed the forecasts.
GRPO, a popular way to do RL on language models, removed the scar on 20 of 20 seeds, and did it again on fresh seeds. PPO, the older standard, set up identically except that it also learns a separate critic to judge each attempt, kept the scar as a ratio while shrinking the gap in absolute terms about as much as GRPO did.5
The likely culprit is distance. GRPO's forecasts drifted about ten times further from where they started, by KL, a standard measure of how different two forecasts are, and a tighter KL leash, a penalty for drifting, slowed the forgetting without stopping it. Its forecasts also got much worse, so some of that cure may just be damage.
Other things we tried:
- LoRA, which finetunes only a small add-on to the weights, removed more of the scar than full finetuning at every rank we tried, at the usual LoRA learning rate. That's the opposite of what the title of LoRA Learns Less and Forgets Less would lead you to expect.6
- Quantization, storing the weights with fewer bits, didn't touch the scar all the way down to 3 bits. At 2 bits the forecasts got worse across the board at the same point the scar moved, so no setting removed the scar without breaking the rest.
- A calm cooldown at the end of pretraining didn't shrink the scar, and if anything made it bigger.
- Distillation, training a fresh model to copy another's outputs, only passed the scar on when the teacher's outputs on extreme days were part of what the student learned from.
- Training on its own output for a few generations thinned the tails, as the model collapse work predicts, and on a synthetic market an inherited scar was gone by the third generation.
- Bigger models seemed to forget more, right up until we reran them on new seeds and the effect vanished, so we withdrew that one.
One extra day
Every model sees Black Monday, October 19, 1987, during finetuning. We slipped one extra copy of it near the end of a boom baby's pretraining, a tiny data poisoning test, about 0.004% of its training targets, trained with a constant learning rate, ran the same finetuning, and tested it on 2006 onward. That model was still measurably more worried on calm days than the twin who never got the extra day.
After all of its training, this model is 17% more worried about a 3% drop on a calm day.
On the validation years, with a constant learning rate, the scar from that single day was about the size of the scar from five years of Depression pretraining, with a wide interval.7 A boom baby fed sixteen copies of the day kept about two thirds of the extra worry through finetuning. With the default cosine schedule the copies arrived when the learning rate was almost zero, and the extra worry left at the end was less than a tenth as big.
We preregistered this along with four other claims, including the late crisis result and that how much crisis data is in the mix matters more than where it goes. All five were picked after seeing the validation years and checked once on the test years. Four held. The one that failed predicted that temperature scaling, a one-knob fix that widens or narrows every forecast, would keep or grow the scar. It grew on the validation years, and on the test years it shrank by about a fifth, though not by enough to be sure.
Malmendier and Nagel fit a single decay parameter for how much past experience counts, where lower means older years count more, so we fit the same one to the networks. People come out between 0.87 and 2.06. The networks come out at 0.72, but with an interval from 0.26 to 1.48, so they may hold on to the distant past a little harder than people do.
What didn't work
We lost to GARCH, a forecasting formula from 1986 that guesses tomorrow's volatility from recent moves using a handful of parameters.
On the test years GARCH beat every network we trained on both of the standard scores for probability forecasts. Early on the networks couldn't even beat EWMA, a weighted average of recent squared returns, at which point we lowered our sanity check and wrote down that we had. On the test years EWMA still beat every network on one of the two scores. In our defense, they're tiny, and the point was to compare them with each other, not to beat GARCH.
Resetting the output layer removed the scar on six seeds and did nothing on twelve. Sampling more futures at prediction time didn't help, and an ensemble of all three eras didn't beat the best single model. Simple trading rules built on the Depression babies did take longer to get back into the market after crashes, 2.3 days against 1.0. Our preregistered version of that test also needed them to hold less stock, and they didn't, so I'd call it a lead, not a result.
We preregistered what would count as failure and then graded ourselves. We made 50 predictions with 80% intervals, so about 40 should have landed, and 35 did, so our own calibration needs work too. The most telling miss was expecting calm days in the test years to be calmer than calm days in the validation years.
We only tested one market and one small architecture, trained one way, and the error bars only cover random seeds on one stretch of history, and we don't know whether any of it carries over to language models. The technical report (PDF) has each claim with its preregistered test, results table and failure condition.
What I'd take from this
Sorted by how much I'd trust them:
- A normal finetune leaves a lot of the old belief behind. Ours ended with about half the scar still there and fading slowly. If this carries over to big models, which we didn't test, a base model you finetune has beliefs from data you'll never see, so check a few things you didn't train on, before and after. Preregistered, out of sample.
- One day of data can outlast finetuning. A single extra copy of Black Monday left a measurable mark after finetuning, and sixteen copies left a bigger one. Preregistered, out of sample.
- Whether late data matters depends on the schedule. With a constant learning rate whatever came last left the bigger mark. With cosine, data seen near the end, when the learning rate was tiny, barely registered. Checked once out of sample for the constant schedule, exploratory for cosine.
- LoRA's usual learning rate undoes its gentleness. At ten times the finetune rate it erased more of the scar than full finetuning did. At the same rate it kept slightly more, though not by enough to be sure. Exploratory, validation years.
- Extrapolating the finetune is a cheap scrub. Doubling the task vector removed most of the scar and barely changed the forecasts. The plasticity methods removed none of it. Exploratory, validation years.
- RL can erase a belief you never targeted, at a price. GRPO wiped out the scar and wrecked the forecasts doing it, so check what RL costs before calling it a cure. Exploratory, validation years.
- Distillation only passes on the tails it sees. The scar transferred only when the teacher's outputs on extreme days were in the student's data. Exploratory, validation years.
Bonus: superstitions
Nothing to do with the scar, but since we had a century of cleaned daily returns lying around, we also checked whether stock returns from 1926 to 2005 have anything to do with the full or new moon, Mercury retrograde, eclipses, Friday the 13th, “sell in May”, the election cycle, rain in New York that day or the day before, or the Super Bowl (the old claim that stocks go up when a team from the original NFL wins).
Nine of the ten did nothing, which will disappoint a few corners of the internet. The Super Bowl indicator survived the correction for testing ten things at once, at about 0.08% a day. It only flips once a year, though, so there are just 39 real data points, and it got famous on roughly this same data. As a check, we also tested the Monday effect: for most of the last century, stocks did noticeably worse on Mondays than on other days, a pattern economists documented decades ago. It showed up clearly, so the test can see a real effect when there is one.
Then we tried 2006 onward, years none of this had touched. The Super Bowl indicator turned slightly negative and called 10 of the 21 years, a bit worse than a coin flip. Even the Monday effect was gone, which others noticed fading years ago.
Down the rabbit hole
Childhood and memory
- Depression Babies, Malmendier and Nagel, the human original.
- Critical Learning Periods in Deep Networks, Achille, Rovere and Soatto.
- Loss of plasticity in deep continual learning, Dohare et al., the continual backprop paper.
- The Primacy Bias in Deep Reinforcement Learning, Nikishin et al.
Therapy
- On Warm Starting Neural Network Training, Ash and Adams, shrink and perturb.
- The Dormant Neuron Phenomenon in Deep Reinforcement Learning, Sokar et al., ReDo.
- LoRA Learns Less and Forgets Less, Biderman et al.
- DeepSeekMath, where GRPO comes from.
Data
- Kenneth French's data library, a century of daily returns, free.
- AI models collapse when trained on recursively generated data, Shumailov et al.
This is research shared for entertainment, not investment, financial or trading advice.
Footnotes
-
With some quirks. Until 1952 the market also traded on Saturdays, and in March 1933 it closed for about ten days for a bank holiday. ↩
-
The ratio there is 1.04, and the interval includes 1. The preregistration flagged this test as underpowered. ↩
-
The interval on this control is wide. Also, because we gave both controls the same training budget, they saw each training window fewer times than the single era models did, so neither is a clean test of order on its own. ↩
-
Everything in this section is exploratory and was run on the validation years, with between 4 and 20 seeds per treatment. ↩
-
Technically we compare the average log of each model's crash probability. Both RL methods shrank the absolute difference about equally; only GRPO also erased the proportional one. You can argue for either view, so we report both. ↩
-
That's ten times the finetune learning rate. At the same learning rate as full finetuning, LoRA kept slightly more of the scar, though not by enough to be sure. ↩
-
The interval runs from 2 to 21 years, and the comparison is across separate batches, so treat it as a rough order of magnitude. ↩